Rally SPAC Presentation Deck slide image

Rally SPAC Presentation Deck

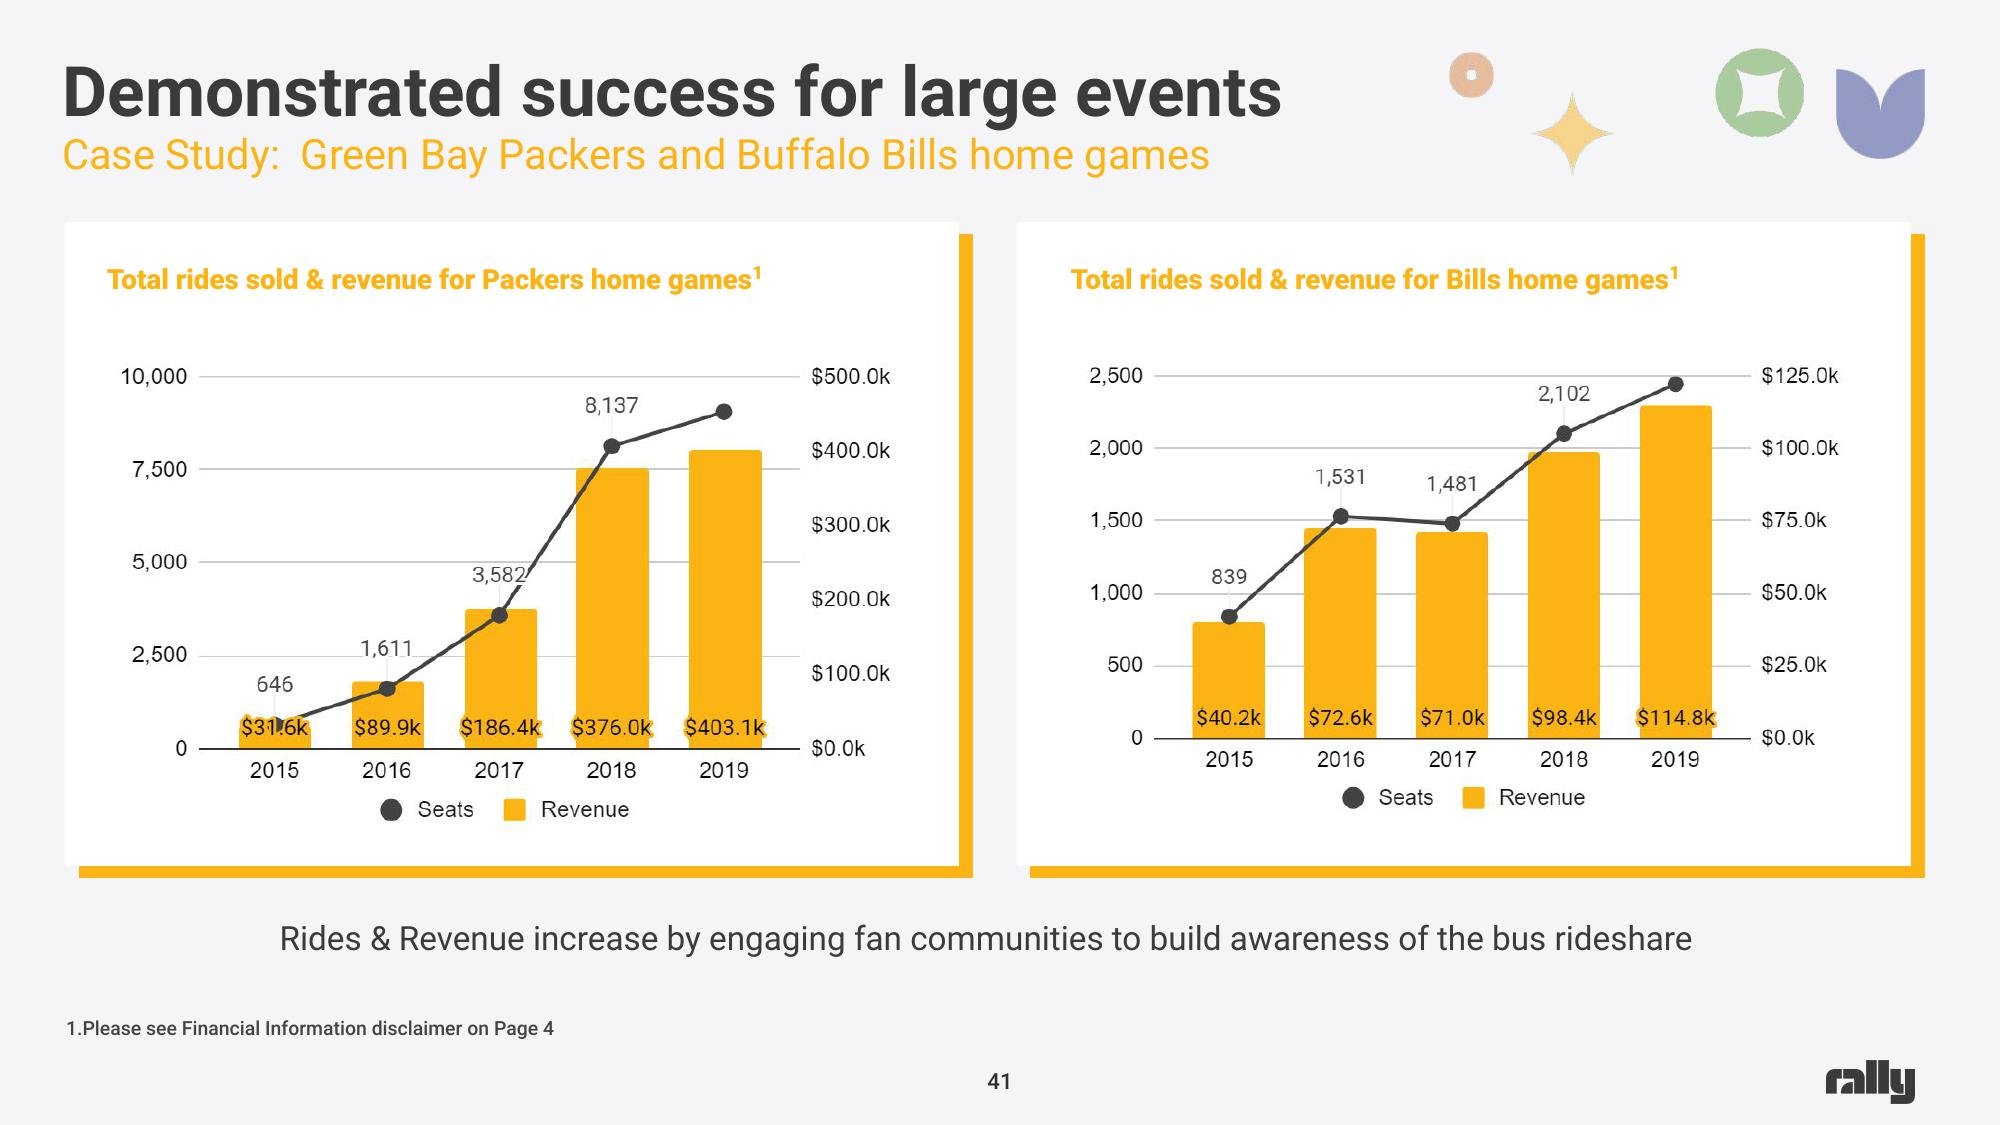
Demonstrated success for large events Case Study: Green Bay Packers and Buffalo Bills home games Total rides sold & revenue for Packers home games¹ 10,000 7,500 5,000 2,500 0 646 $31.6k 2015 1,611 3,582 $89.9k $186.4k $376.0k $403.1k 2016 2017 2018 2019 Revenue Seats 8,137 1.Please see Financial Information disclaimer on Page 4 $500.0k $400.0k $300.0k $200.0k $100.0k $0.0k Total rides sold & revenue for Bills home games¹ 41 2,500 2,000 1,500 1,000 500 0 839 1,531 1,481 2,102 $40.2k $72.6k $71.0k $98.4k $114.8k 2018 Revenue 2015 2016 2017 2019 Seats Rides & Revenue increase by engaging fan communities to build awareness of the bus rideshare $125.0k $100.0k $75.0k $50.0k $25.0k $0.0K rally
View entire presentation