Hostess SPAC Presentation Deck
PAGE
5
BRAND STRENGTH DRIVING GROWTH AND
CATEGORY
(1)
(2)
Special emotional relationship with consumers
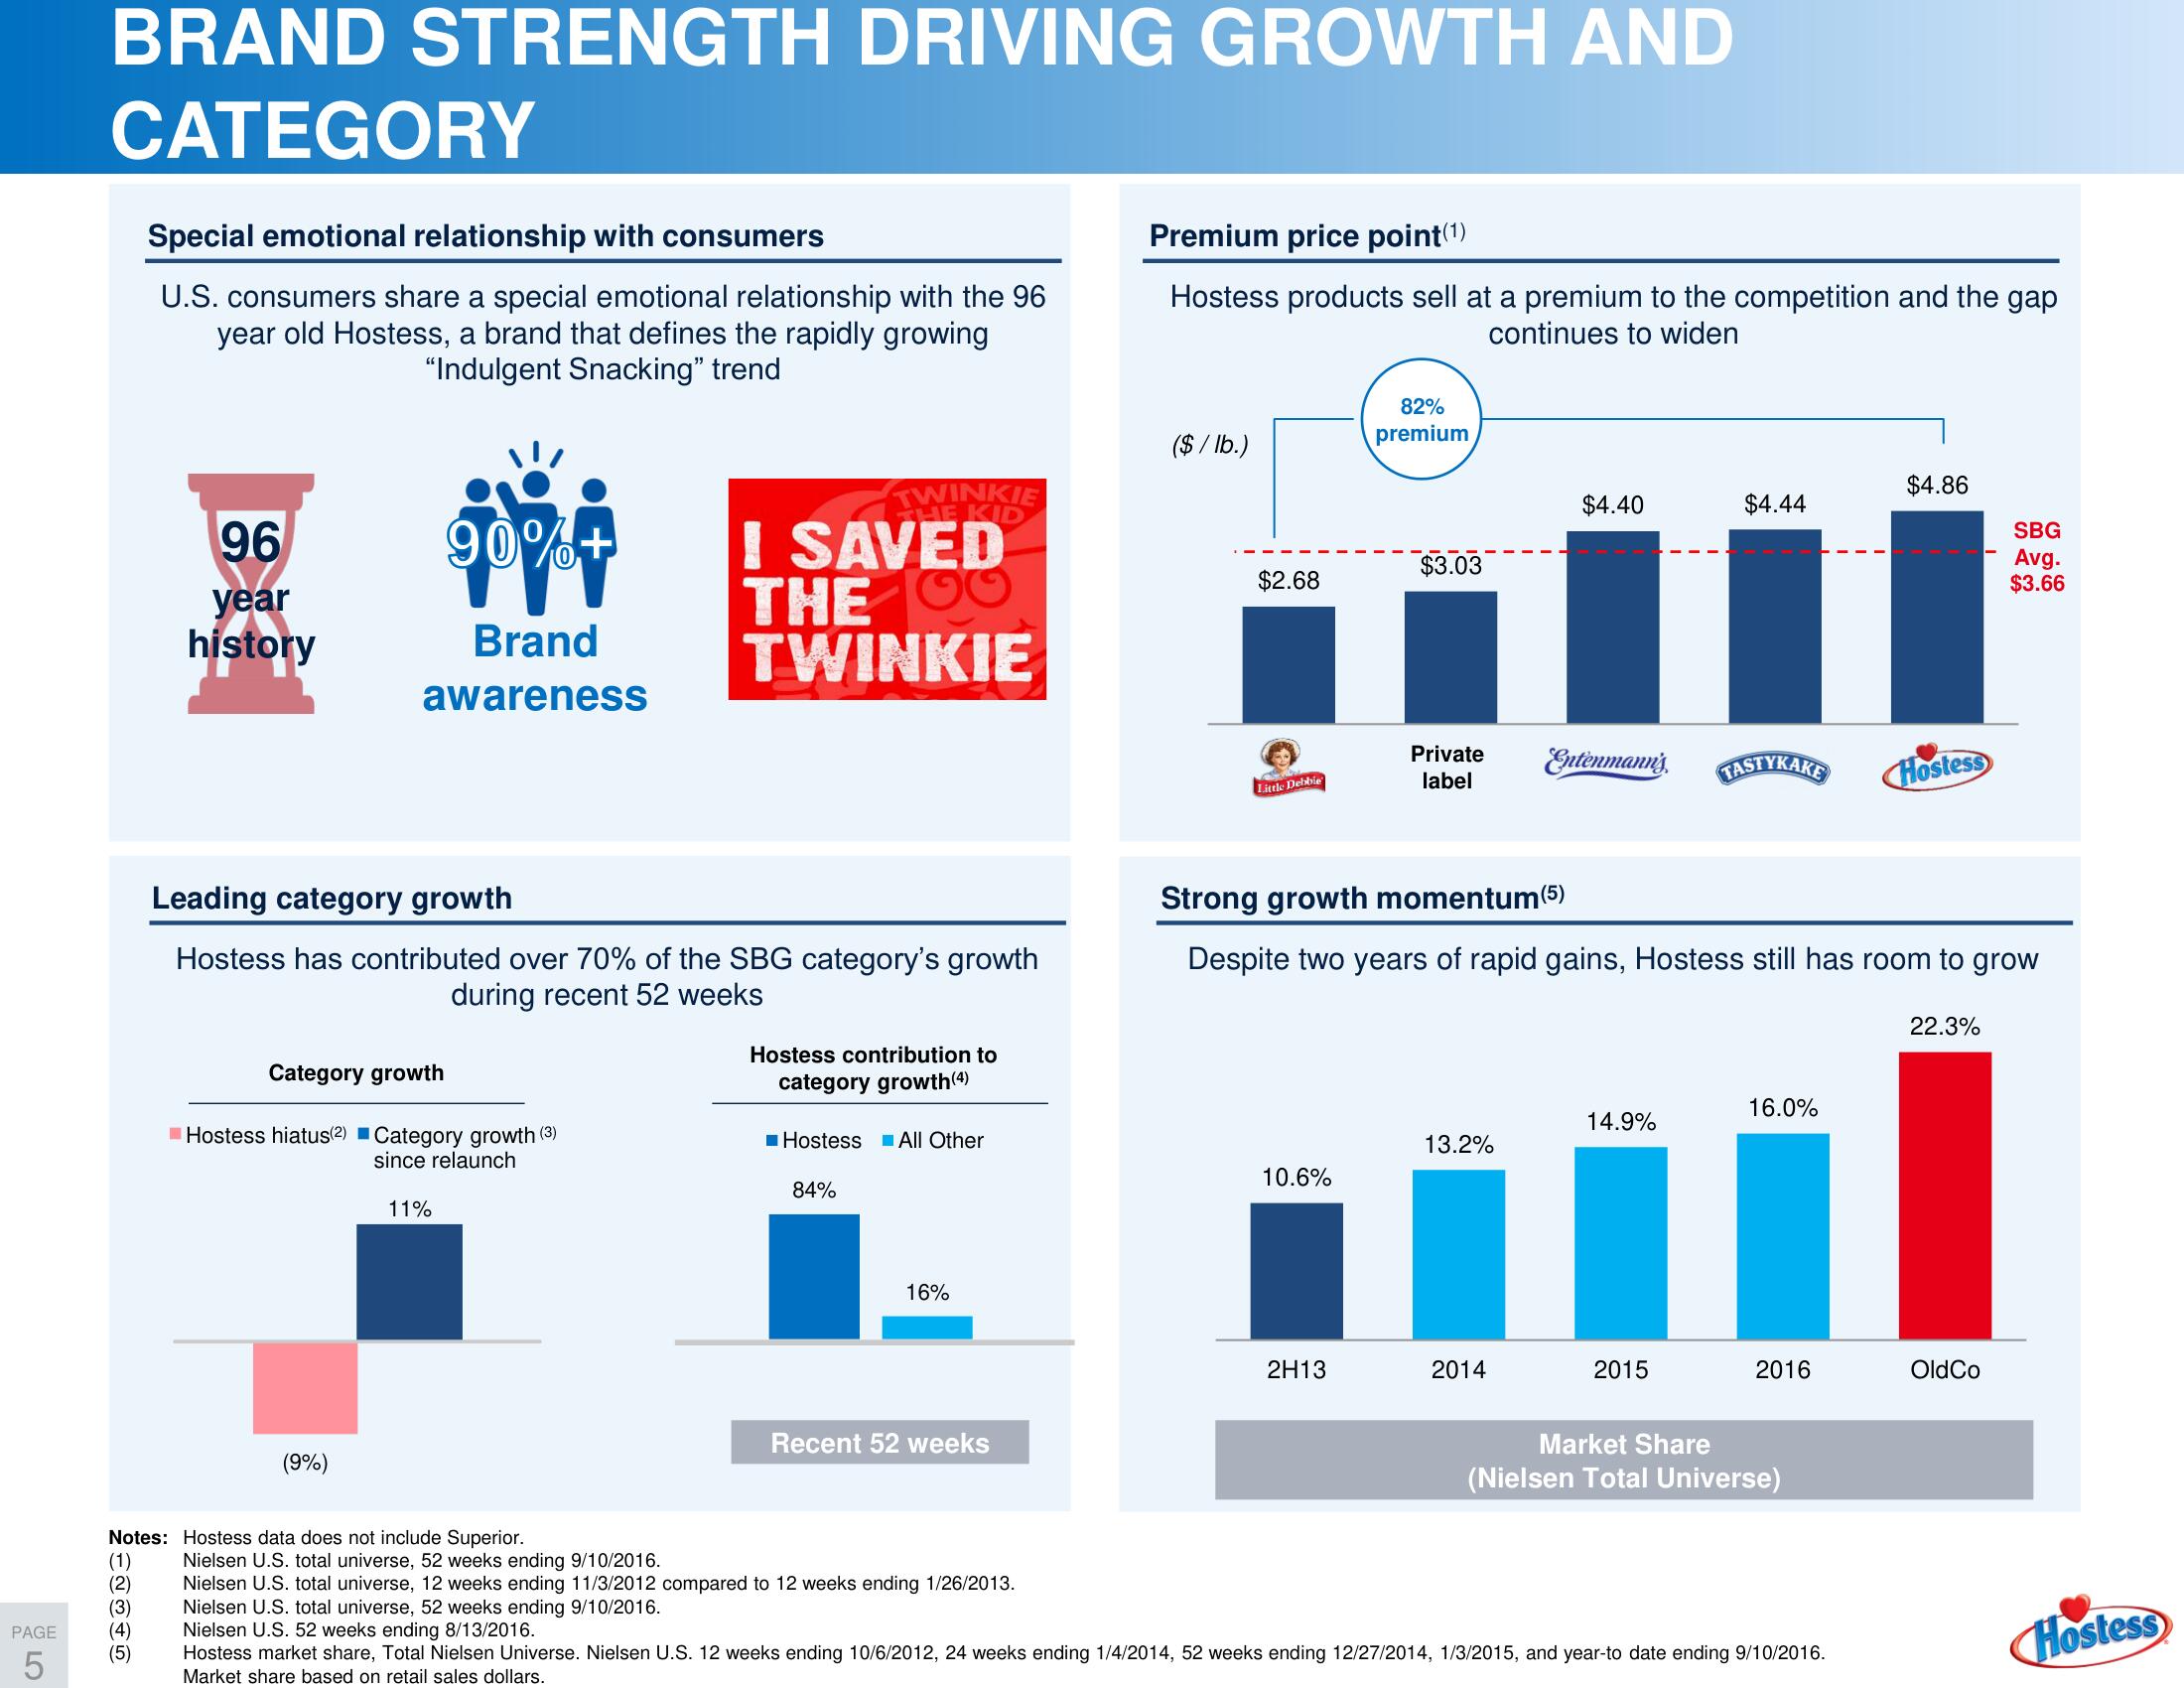
U.S. consumers share a special emotional relationship with the 96
year old Hostess, a brand that defines the rapidly growing
"Indulgent Snacking" trend
(3)
(4)
(5)
96
year
history
90%+
Brand
awareness
Leading category growth
Hostess has contributed over 70% of the SBG category's growth
during recent 52 weeks
Category growth
Hostess hiatus(2) Category growth (3)
since relaunch
(9%)
Notes: Hostess data does not include Superior.
11%
TWINKIE
THE KID
I SAVED
THE O
TWINKIE
Hostess contribution to
category growth (4)
Hostess All Other
84%
16%
Recent 52 weeks
Nielsen U.S. total universe, 52 weeks ending 9/10/2016.
Nielsen U.S. total universe, 12 weeks ending 11/3/2012 compared to 12 weeks ending 1/26/2013.
Premium price point(¹)
Hostess products sell at a premium to the competition and the gap
continues to widen
($/lb.)
$2.68
Little Debbie
10.6%
82%
premium
2H13
$3.03
$4.40
Private Entenmann's TASTYKAKE
label
13.2%
2014
Strong growth momentum (5)
Despite two years of rapid gains, Hostess still has room to grow
$4.44
14.9%
2015
16.0%
2016
Market Share
(Nielsen Total Universe)
$4.86
Nielsen U.S. total universe, 52 weeks ending 9/10/2016.
Nielsen U.S. 52 weeks ending 8/13/2016.
Hostess market share, Total Nielsen Universe. Nielsen U.S. 12 weeks ending 10/6/2012, 24 weeks ending 1/4/2014, 52 weeks ending 12/27/2014, 1/3/2015, and year-to date ending 9/10/2016.
Market share based on retail sales dollars.
Hostess
22.3%
SBG
Avg.
$3.66
Old Co
HostessView entire presentation