Pathward Financial Results Presentation Deck
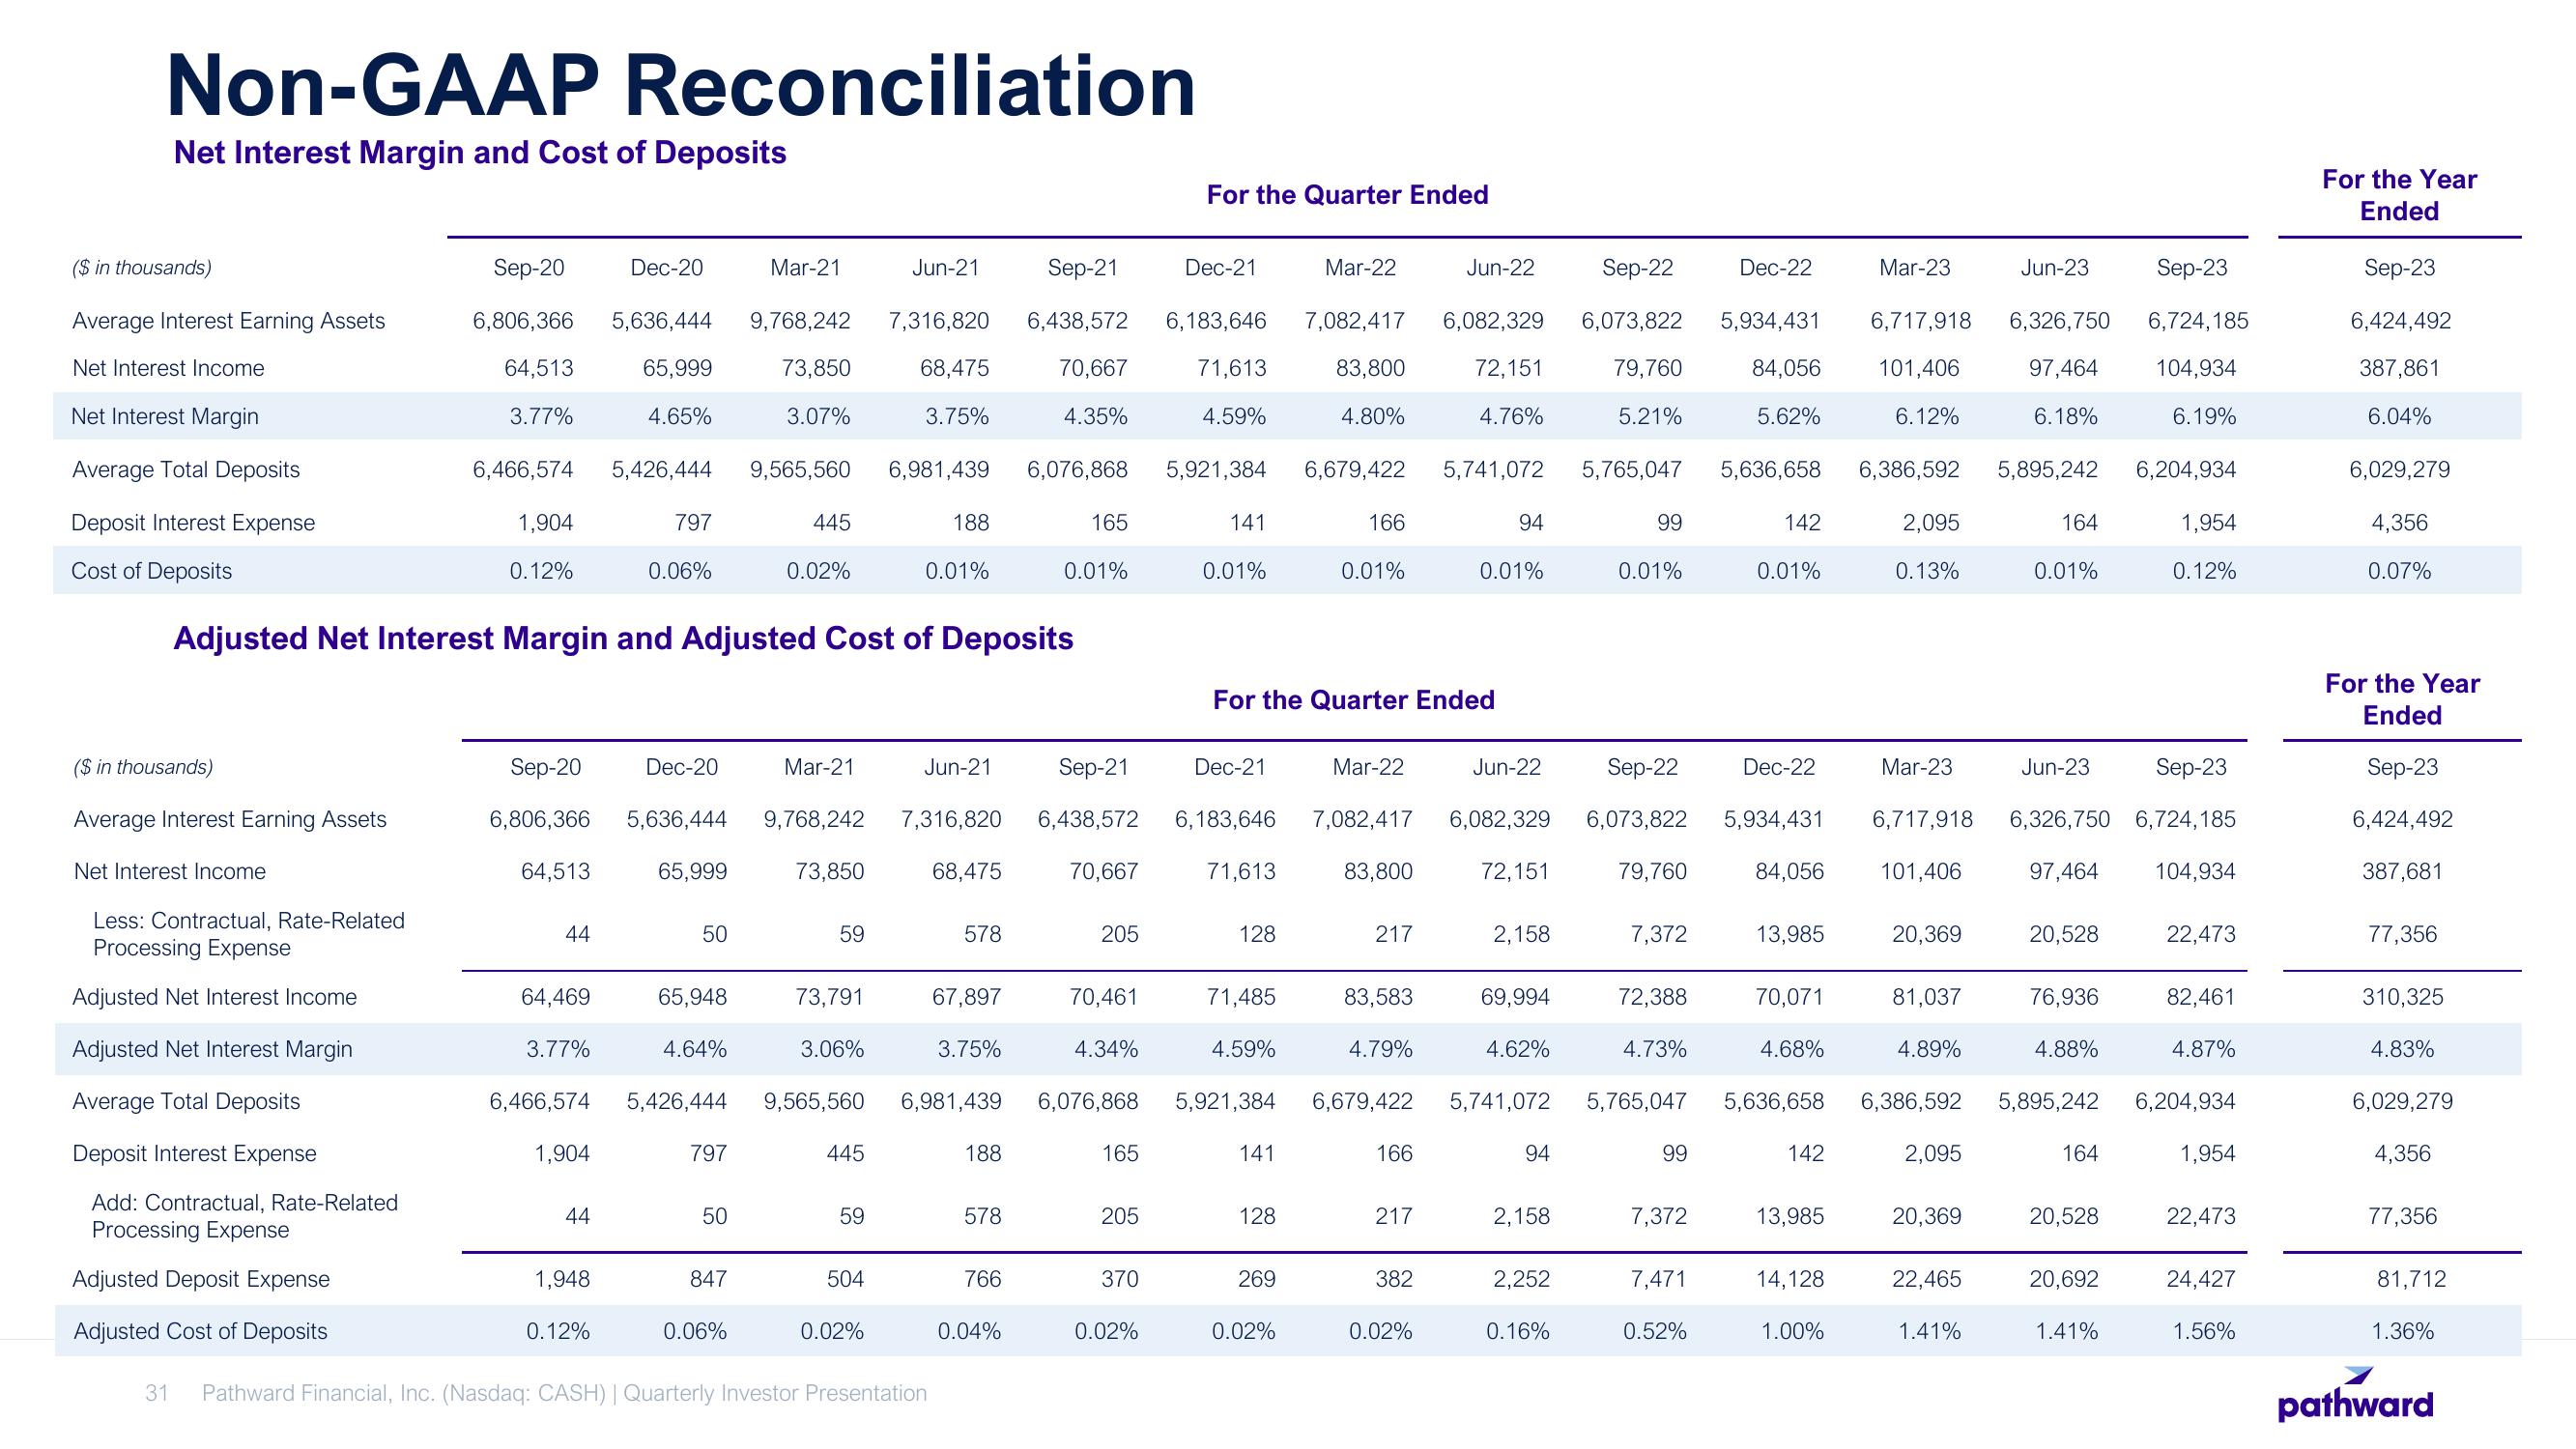
Non-GAAP Reconciliation
Net Interest Margin and Cost of Deposits
($ in thousands)
Average Interest Earning Assets
Net Interest Income
Net Interest Margin
Average Total Deposits
Deposit Interest Expense
Cost of Deposits
($ in thousands)
Average Interest Earning Assets
Net Interest Income
Less: Contractual, Rate-Related
Processing Expense
Adjusted Net Interest Income
Adjusted Net Interest Margin
Average Total Deposits
Deposit Interest Expense
Add: Contractual, Rate-Related
Processing Expense
Sep-20
6,806,366 5,636,444 9,768,242 7,316,820
64,513 65,999 73,850 68,475
3.77%
4.65%
3.75%
3.07%
Adjusted Deposit Expense
Adjusted Cost of Deposits
6,466,574 5,426,444
Sep-20
6,806,366
64,513
44
64,469
3.77%
6,466,574
1,904
Dec-20
1,904
0.12%
Adjusted Net Interest Margin and Adjusted Cost of Deposits
44
1,948
0.12%
797
0.06%
Dec-20
65,999
50
65,948
4.64%
5,426,444
797
50
Mar-21
847
9,565,560
0.06%
445
0.02%
Sep-21
5,636,444 9,768,242 7,316,820 6,438,572
73,850 68,475
Mar-21
59
73,791
3.06%
445
Jun-21
59
6,981,439
504
0.02%
188
0.01%
Jun-21
31 Pathward Financial, Inc. (Nasdaq: CASH) | Quarterly Investor Presentation
578
67,897
3.75%
188
578
Sep-21
6,438,572 6,183,646
70,667 71,613
4.35%
766
0.04%
165
6,076,868 5,921,384
0.01%
70,667
205
70,461
4.34%
165
For the Quarter Ended
205
370
Dec-21
0.02%
4.59%
141
0.01%
Dec-21
71,613
9,565,560 6,981,439 6,076,868 5,921,384 6,679,422
128
71,485
4.59%
For the Quarter Ended
141
Mar-22
128
269
Sep-22
7,082,417 6,082,329 6,073,822
83,800 72,151
79,760
4.76%
5.21%
4.80%
0.02%
6,679,422 5,741,072
166
0.01%
Mar-22
217
83,583
4.79%
Jun-22
Sep-22
6,183,646 7,082,417 6,082,329 6,073,822 5,934,431
83,800 72,151
166
217
382
0.02%
94
0.01%
Jun-22
2,158
69,994
4.62%
5,741,072
94
2,158
2,252
0.16%
99
0.01%
79,760
7,372
5,765,047 5,636,658 6,386,592 5,895,242 6,204,934
72,388
4.73%
5,765,047
99
Dec-22
7,372
5,934,431
84,056
5.62%
7,471
0.52%
142
0.01%
Dec-22
84,056
13,985
70,071
4.68%
5,636,658
142
13,985
14,128
Sep-23
6,717,918 6,326,750 6,724,185
101,406 97,464 104,934
6.18%
6.19%
1.00%
Mar-23
6.12%
2,095
0.13%
Mar-23
20,369
81,037
Sep-23
6,717,918 6,326,750 6,724,185
101,406
97,464 104,934
4.89%
Jun-23
2,095
20,369
164
22,465
1.41%
0.01%
Jun-23
20,528
76,936
4.88%
6,386,592 5,895,242 6,204,934
164
20,528
1,954
0.12%
20,692
1.41%
22,473
82,461
4.87%
1,954
22,473
24,427
1.56%
For the Year
Ended
Sep-23
6,424,492
387,861
6.04%
6,029,279
4,356
0.07%
For the Year
Ended
Sep-23
6,424,492
387,681
77,356
310,325
4.83%
6,029,279
4,356
77,356
81,712
1.36%
pathwardView entire presentation