Bird Investor Presentation Deck
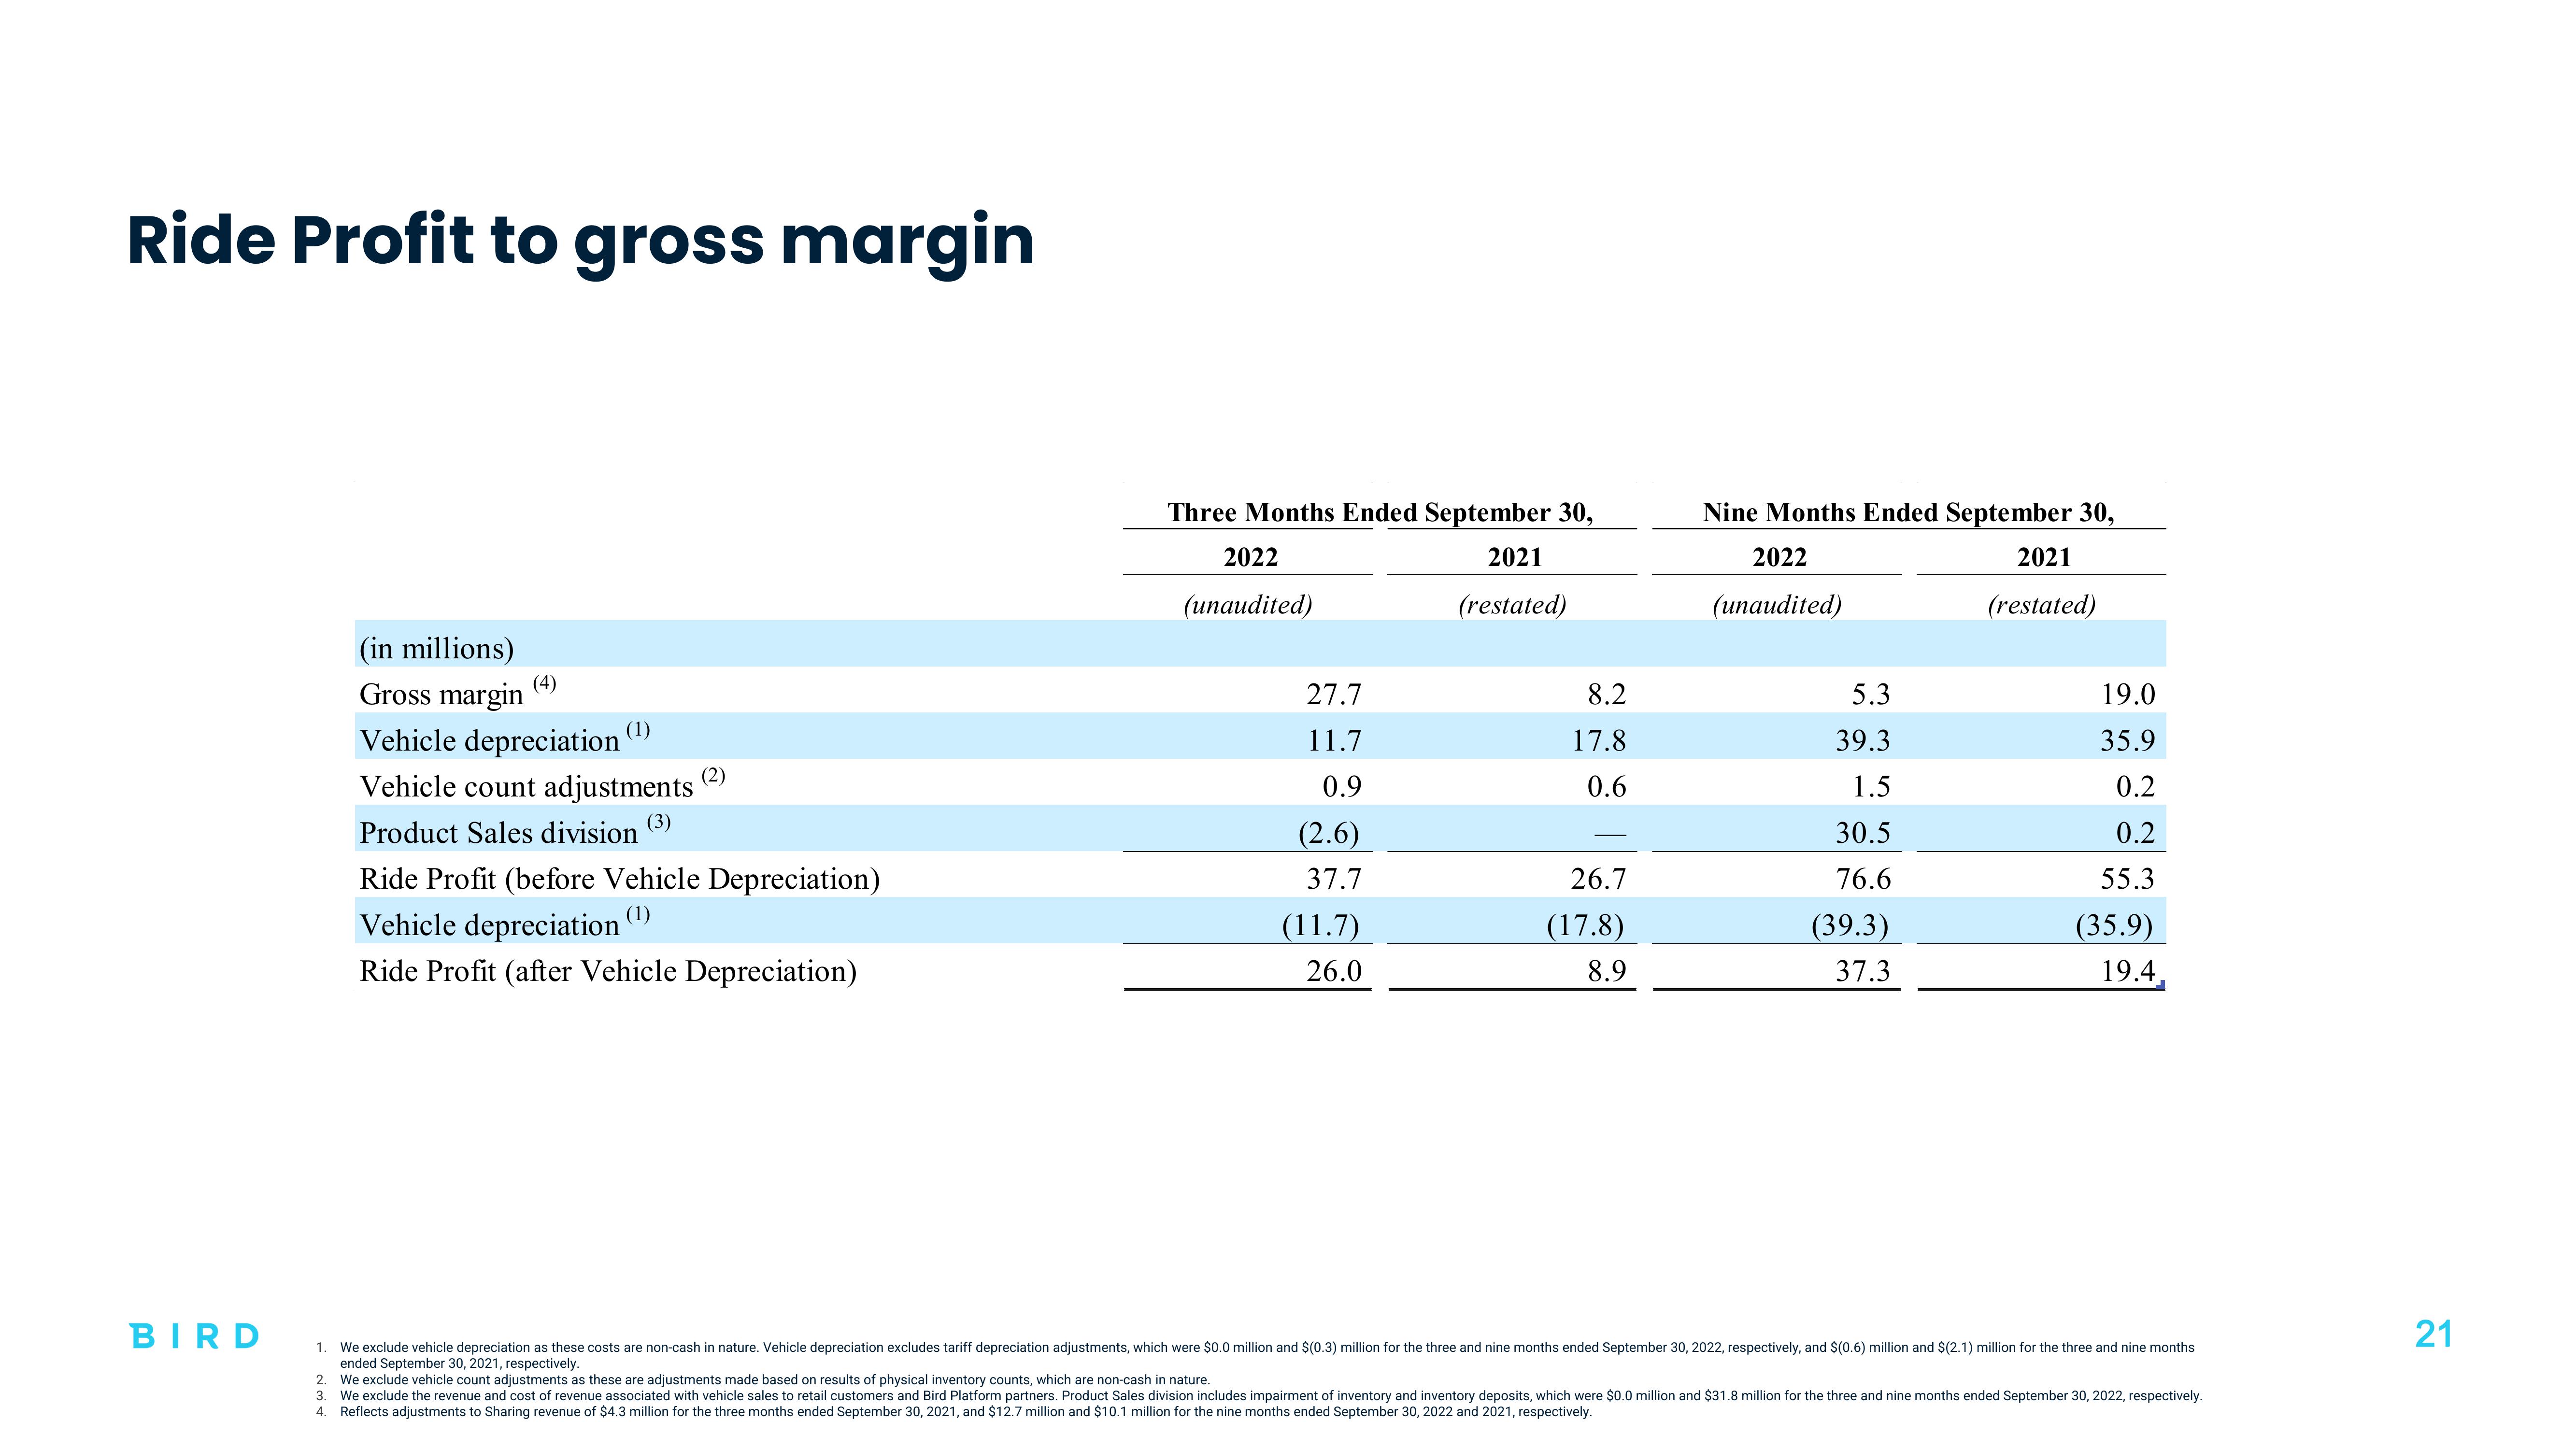
Ride Profit to gross margin
BIRD
(in millions)
Gross margin
Vehicle depreciation
Vehicle count adjustments
Product Sales division (3)
(1)
(2)
Ride Profit (before Vehicle Depreciation)
(1)
Vehicle depreciation
Ride Profit (after Vehicle Depreciation)
Three Months Ended September 30,
2021
(restated)
2022
(unaudited)
27.7
11.7
0.9
(2.6)
37.7
(11.7)
26.0
8.2
17.8
0.6
26.7
(17.8)
8.9
Nine Months Ended September 30,
2022
(unaudited)
2021
(restated)
5.3
39.3
1.5
30.5
76.6
(39.3)
37.3
19.0
35.9
0.2
0.2
55.3
(35.9)
19.4.
1. We exclude vehicle depreciation as these costs are non-cash in nature. Vehicle depreciation excludes tariff depreciation adjustments, which were $0.0 million and $(0.3) million for the three and nine months ended September 30, 2022, respectively, and $(0.6) million and $(2.1) million for the three and nine months
ended September 30, 2021, respectively.
2. We exclude vehicle count adjustments as these are adjustments made based on results of physical inventory counts, which are non-cash in nature.
3. We exclude the revenue and cost of revenue associated with vehicle sales to retail customers and Bird Platform partners. Product Sales division includes impairment of inventory and inventory deposits, which were $0.0 million and $31.8 million for the three and nine months ended September 30, 2022, respectively.
4. Reflects adjustments to Sharing revenue of $4.3 million for the three months ended September 30, 2021, and $12.7 million and $10.1 million for the nine months ended September 30, 2022 and 2021, respectively.
21View entire presentation