Comcast Results Presentation Deck
Free Cash Flow and Capital Allocation
Capital Allocation Priorities
8
●
Maintaining a strong balance sheet
Investing organically for profitable growth
Returning capital to shareholders
Balance Sheet Statistics
Consolidated Net
Leverage
Consolidated Net
Debt ($B)
2.8x
$89.3
3Q20
2.4x
$82.3
3Q21
Consolidated Capital*
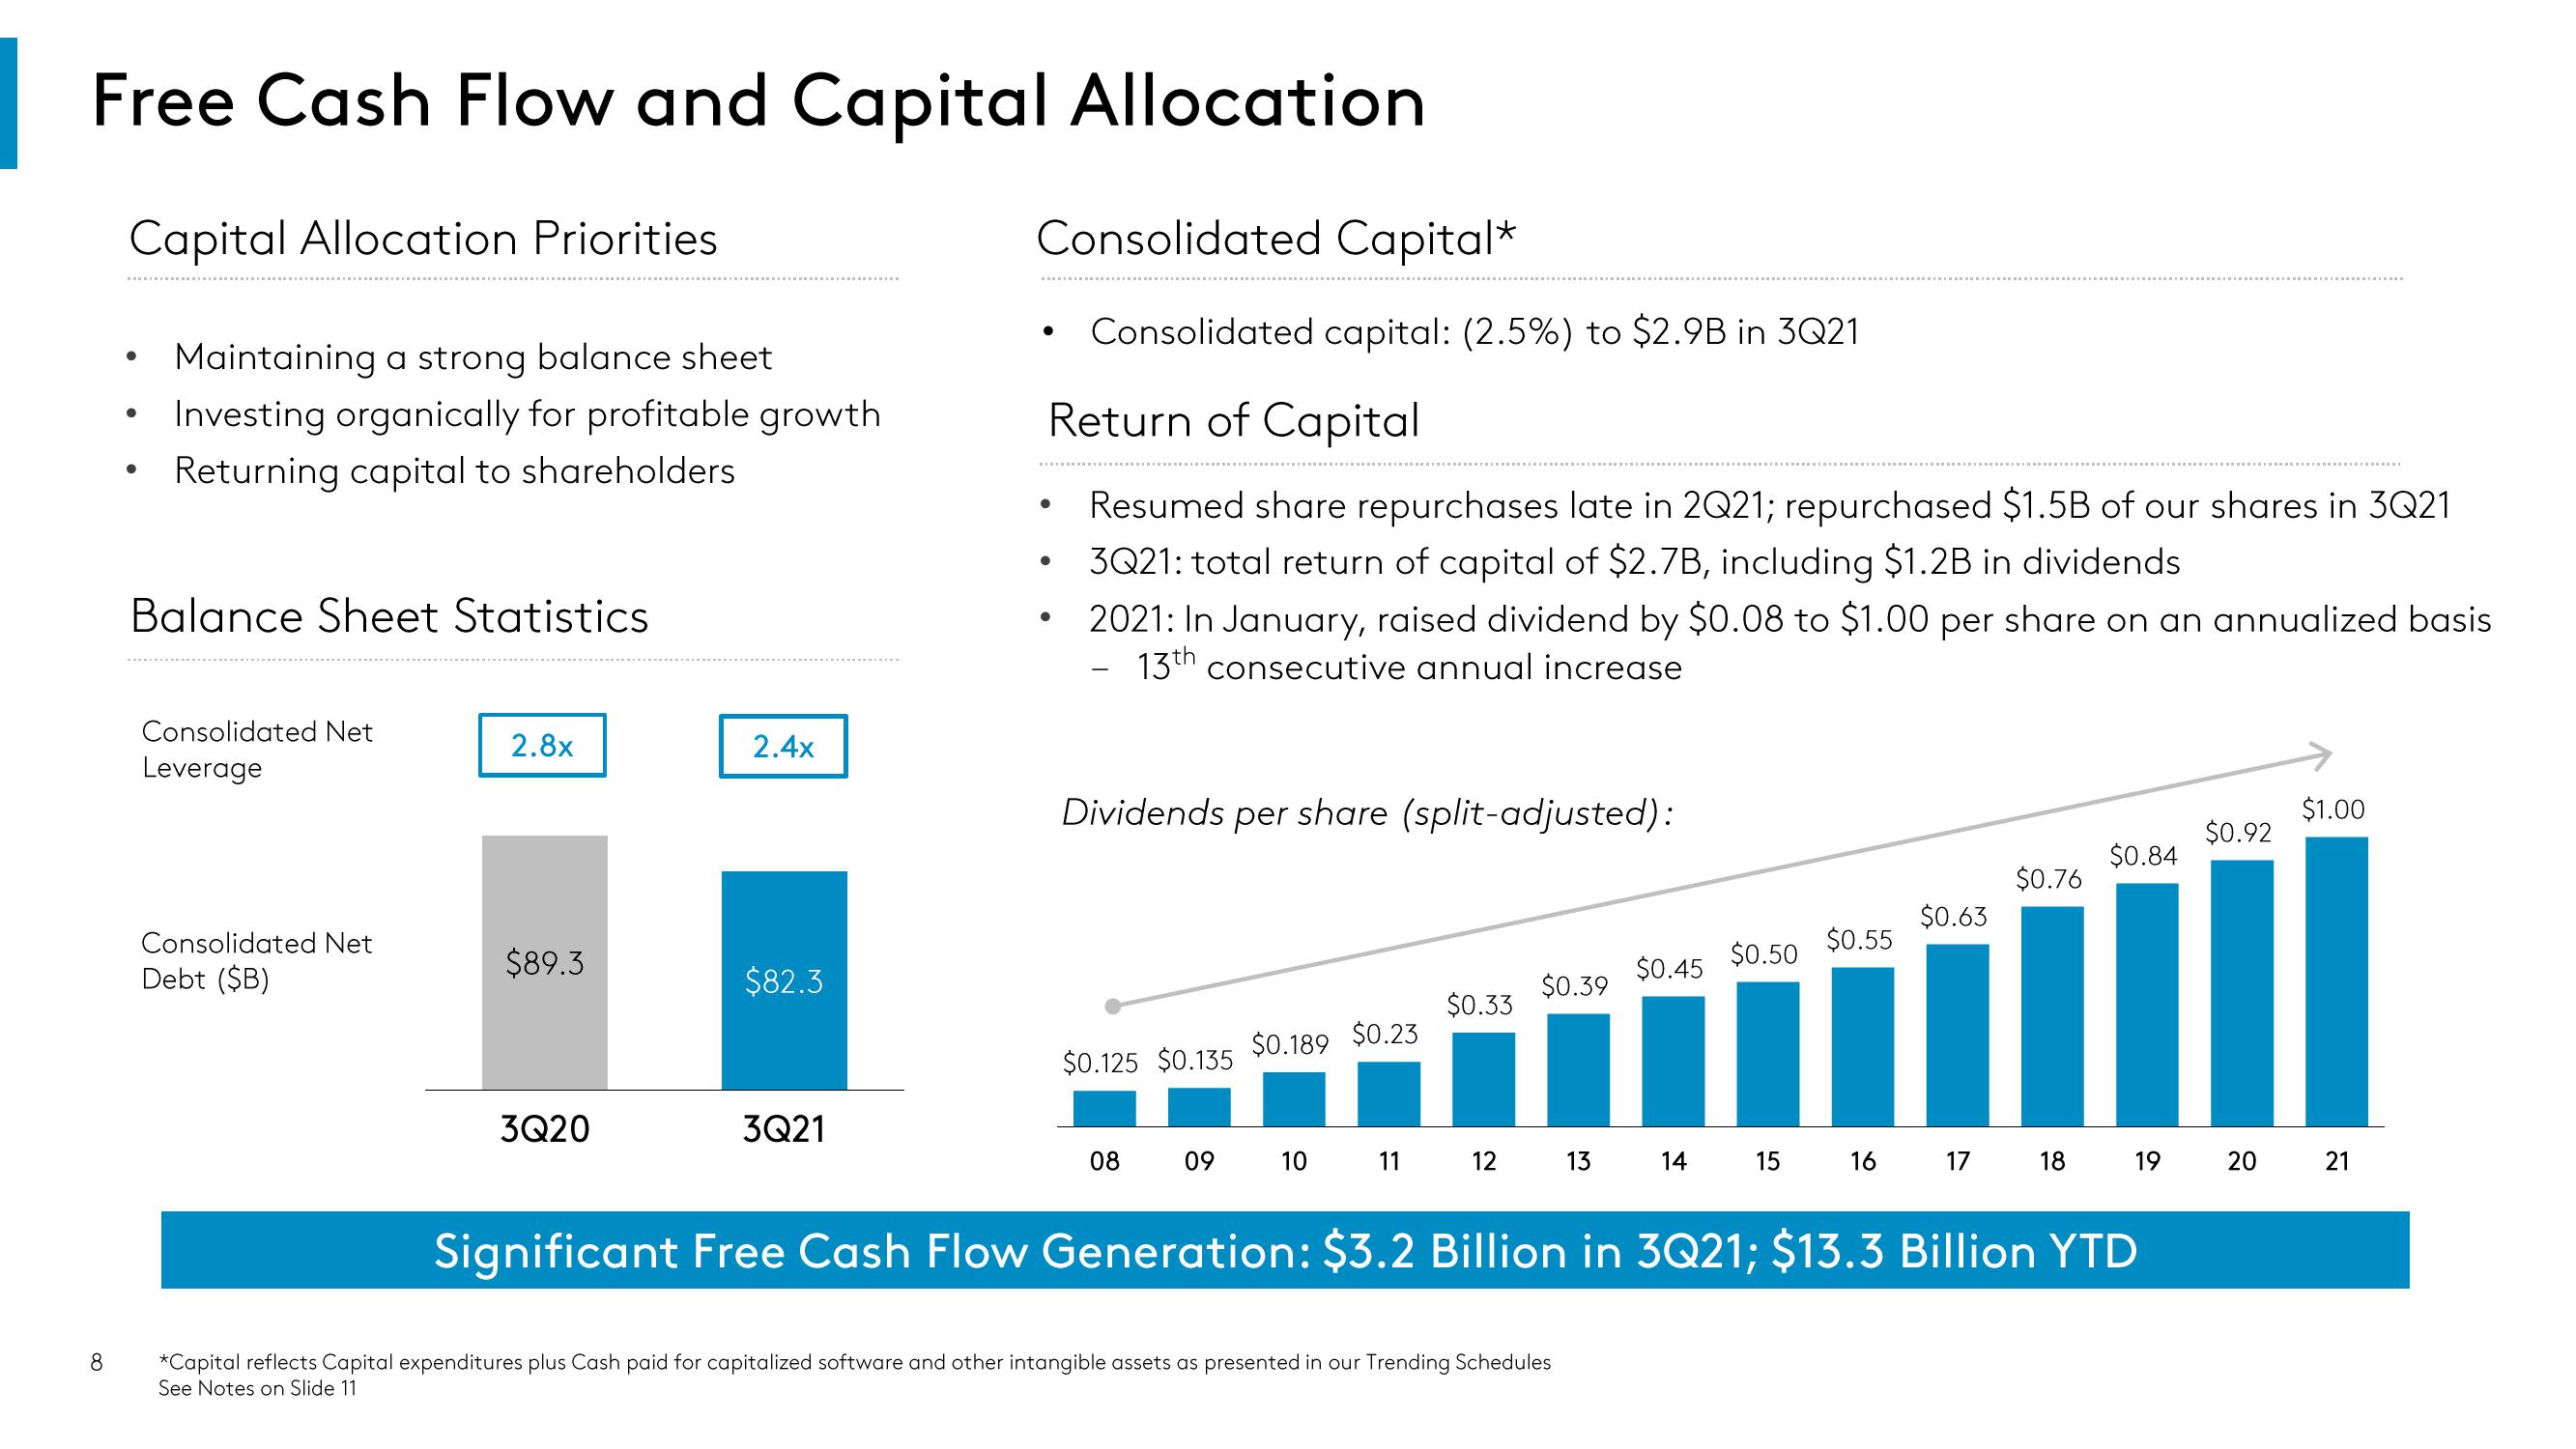
Consolidated capital: (2.5%) to $2.9B in 3Q21
Return of Capital
Resumed share repurchases late in 2Q21; repurchased $1.5B of our shares in 3Q21
3Q21: total return of capital of $2.7B, including $1.2B in dividends
2021: In January, raised dividend by $0.08 to $1.00 per share on an annualized basis
13th consecutive annual increase
●
●
●
Dividends per share (split-adjusted):
$0.125 $0.135 $0.189 $0.23
08
09
10
11
$0.33
12
$0.39
13
*Capital reflects Capital expenditures plus Cash paid for capitalized software and other intangible assets as presented in our Trending Schedules
See Notes on Slide 11
$0.45
14
$0.50
15
$0.55
16
$0.63
17
$0.76
18
$0.84
19
Significant Free Cash Flow Generation: $3.2 Billion in 3Q21; $13.3 Billion YTD
$0.92
20
$1.00
21View entire presentation