Evercore Investment Banking Pitch Book
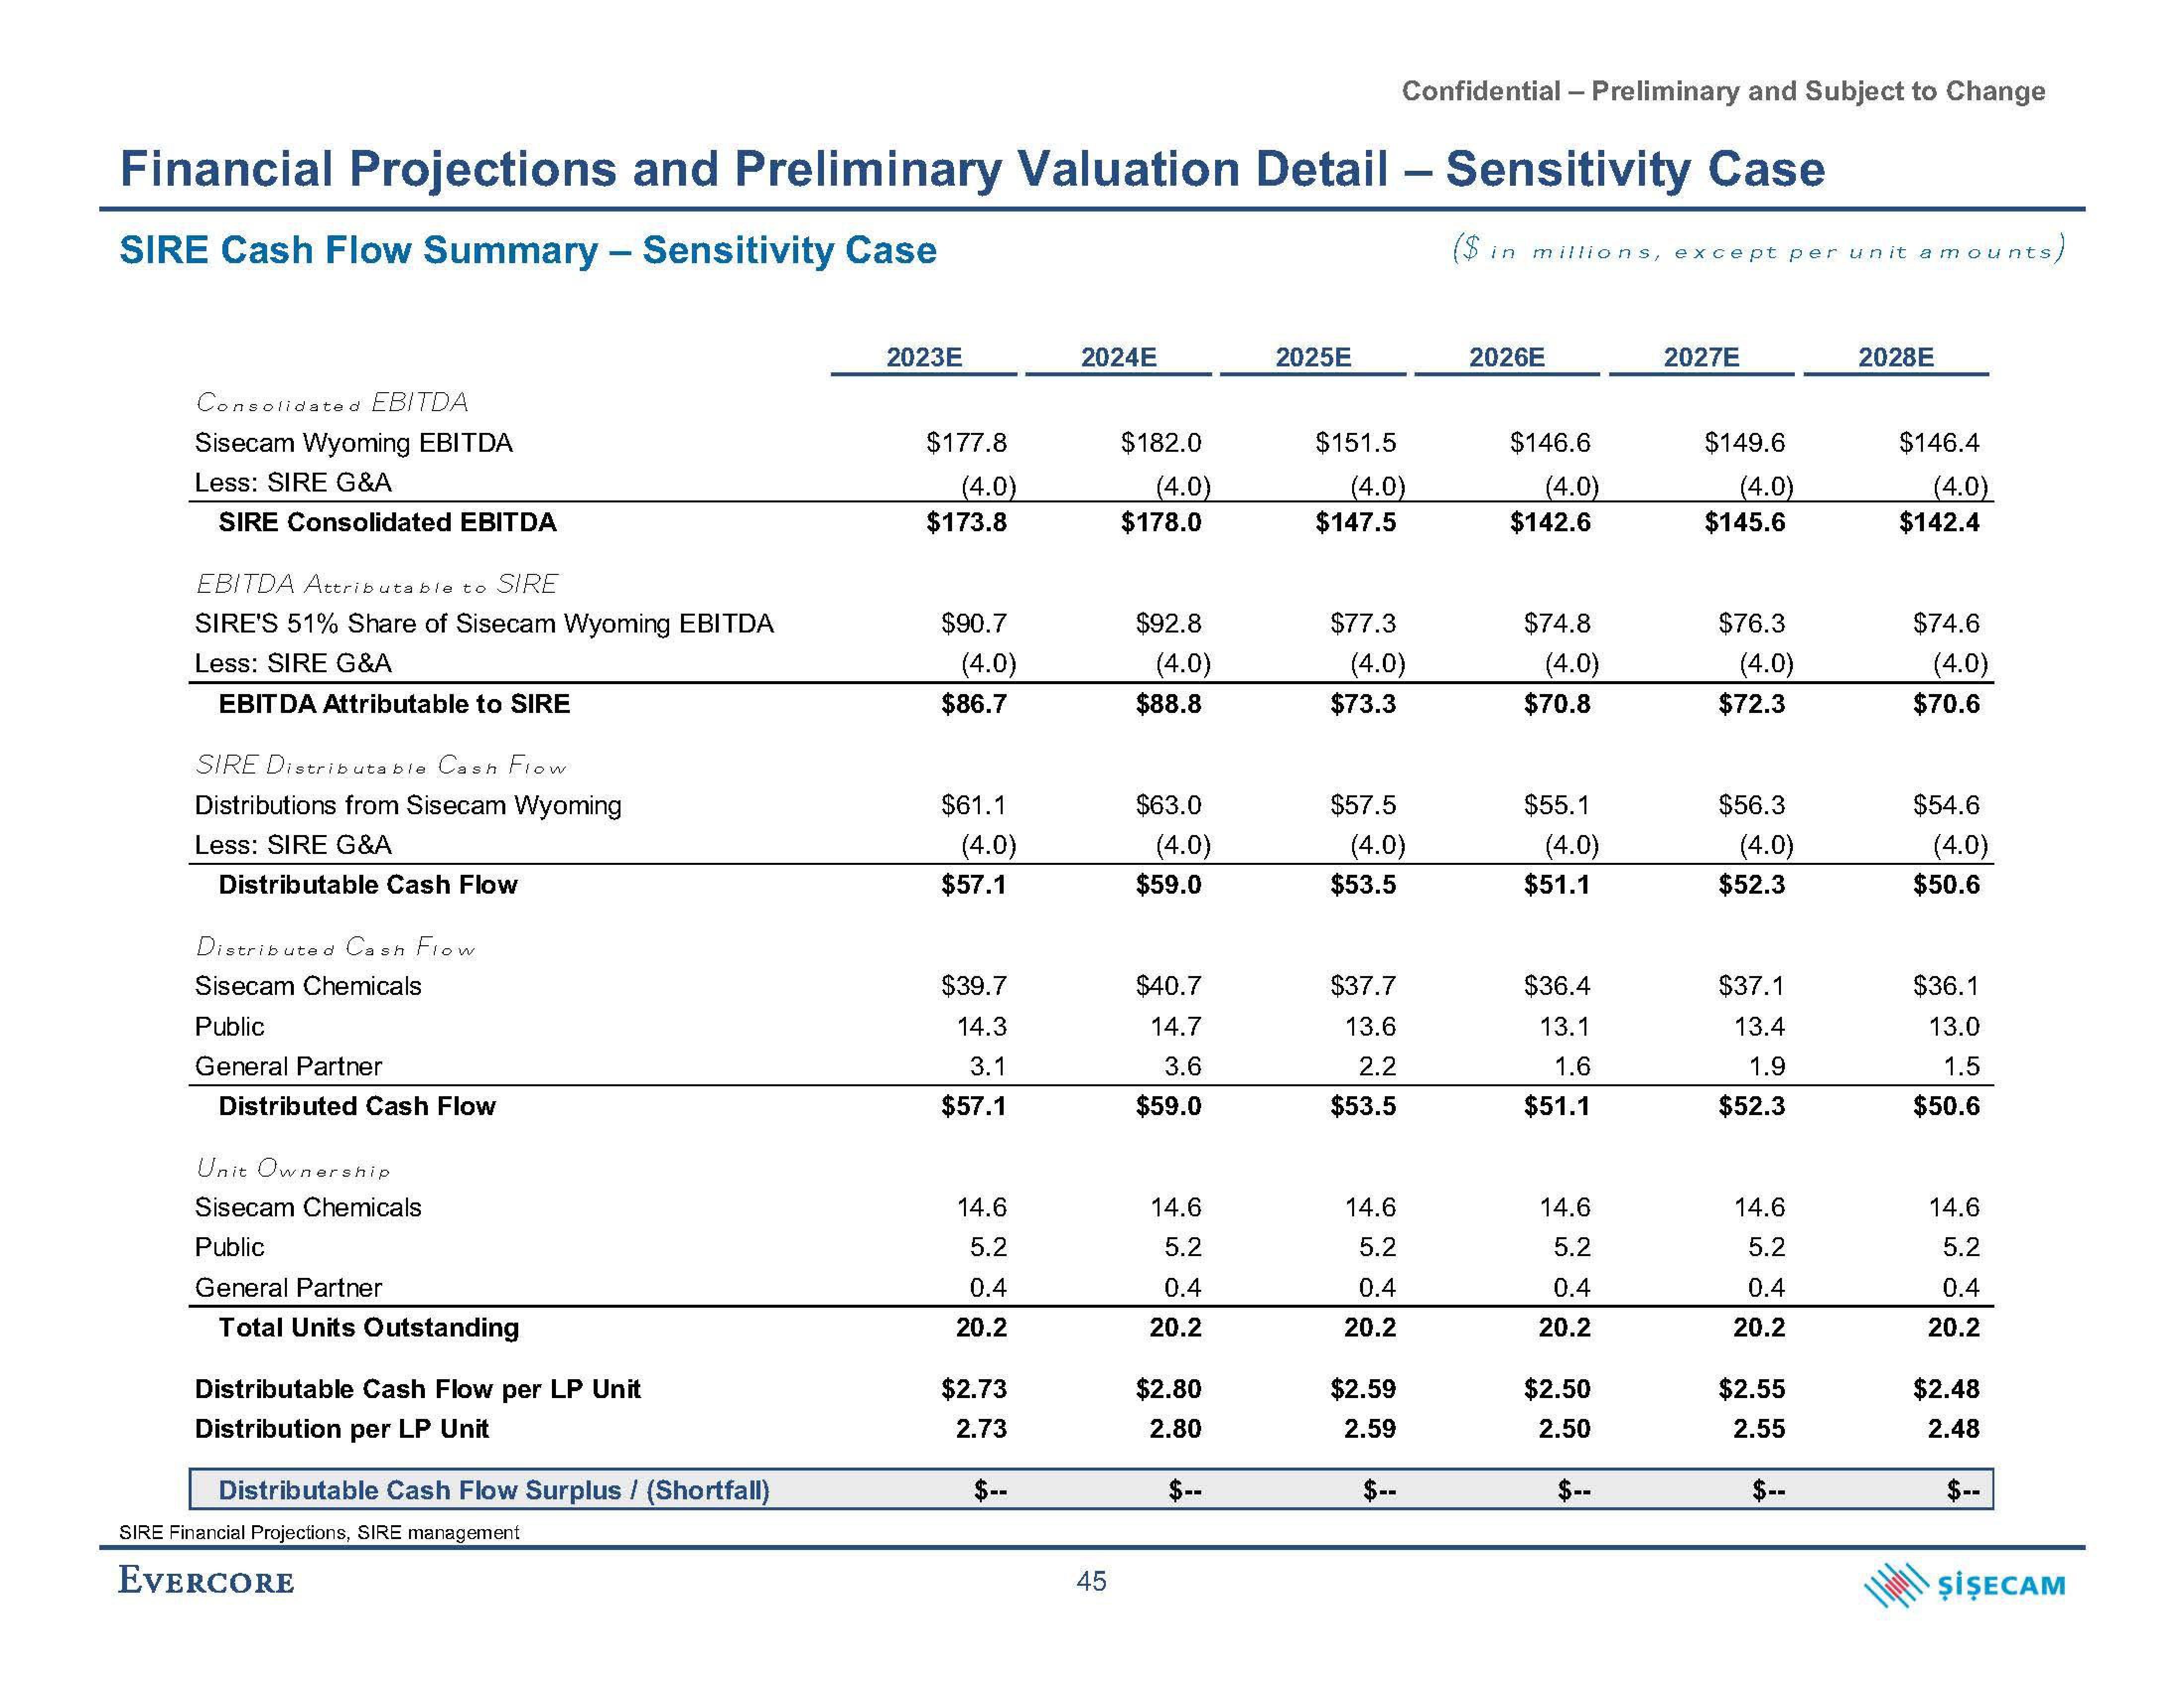
Financial Projections and Preliminary Valuation Detail - Sensitivity Case
SIRE Cash Flow Summary - Sensitivity Case
Consolidated EBITDA
Sisecam Wyoming EBITDA
Less: SIRE G&A
SIRE Consolidated EBITDA
EBITDA Attributable to SIRE
SIRE'S 51% Share of Sisecam Wyoming EBITDA
Less: SIRE G&A
EBITDA Attributable to SIRE
SIRE Distributable Cash Flow
Distributions from Sisecam Wyoming
Less: SIRE G&A
Distributable Cash Flow
Distributed Cash Flow
Sisecam Chemicals
Public
General Partner
Distributed Cash Flow
Unit Ownership
Sisecam Chemicals
Public
General Partner
Total Units Outstanding
Distributable Cash Flow per LP Unit
Distribution per LP Unit
Distributable Cash Flow Surplus/ (Shortfall)
SIRE Financial Projections, SIRE management
EVERCORE
2023E
$177.8
(4.0)
$173.8
$90.7
(4.0)
$86.7
$61.1
(4.0)
$57.1
$39.7
14.3
3.1
$57.1
14.6
5.2
0.4
20.2
$2.73
2.73
$-
2024E
45
$182.0
(4.0)
$178.0
$92.8
(4.0)
$88.8
$63.0
(4.0)
$59.0
$40.7
14.7
3.6
$59.0
14.6
5.2
0.4
20.2
$2.80
2.80
$--
2025E
$151.5
(4.0)
$147.5
$77.3
(4.0)
$73.3
$57.5
(4.0)
$53.5
Confidential - Preliminary and Subject to Change
$37.7
13.6
2.2
$53.5
14.6
5.2
0.4
20.2
$2.59
2.59
$--
($ in millions, except per unit amounts,
2026E
$146.6
(4.0)
$142.6
$74.8
(4.0)
$70.8
$55.1
(4.0)
$51.1
$36.4
13.1
1.6
$51.1
14.6
5.2
0.4
20.2
$2.50
2.50
$--
2027E
$149.6
(4.0)
$145.6
$76.3
(4.0)
$72.3
$56.3
(4.0)
$52.3
$37.1
13.4
1.9
$52.3
14.6
5.2
0.4
20.2
$2.55
2.55
$--
2028E
$146.4
(4.0)
$142.4
$74.6
(4.0)
$70.6
$54.6
(4.0)
$50.6
$36.1
13.0
1.5
$50.6
14.6
5.2
0.4
20.2
$2.48
2.48
ŞİŞECAMView entire presentation