DraftKings Investor Day Presentation Deck
Detailed overview of methodology for cohort customer retention and revenue
retention
Acquisition Quarter, Consecutive Full Quarters of Data
Acquired
Cohort
Q3 2018
Q4 2019
Q1 2019
.
.
State
NJ
WV
IN
PA
NH
IA
8
CO
Q2 2019
Q3 2019
Q4 2019
Q1 2020
Q2 2020
Q3 2020
Q4 2020
Q3 2019
Q4 2019
Q1 2020
Q2 2020
Q3 2020
Q4 2020
Q4 2019
Q1 2020
Q2 2020
Q3 2020
Q4 2020
Q4 2019
Q1 2020
Q2 2020
Q3 2020
Q4 2020
Q4 2019
Q1 2020
Q2 2020
Q3 2020
Q4 2020
Q1 2020
Q2 2020
Q3 2020
Q4 2020
Q2 2020
Q3 2020
Q4 2020
Q3 2020
Q4 2020
Q4 2020
Q3
2018
Acq.
Q4
2018
1
Acq.
Q1
2019
2
1
Acq.
Q2
2019
3
2
1
Acq.
Q3
2019
4
3
2
1
Acq.
Acq.
Q4
2019
5
4
3
2
1
Acq.
1
Acq.
Acq.
Acq.
Acq.
Q1
2020
6
5
4
3
2
1
Acq.
2
1
Acq.
1
Acq.
1
Acq.
1
Acq.
Acq.
Q2
2020
7
6
5
4
3
2
1
Acq.
3
2
1
Acq.
2
1
Acq.
2
1
Acq.
2
1
Acq.
1
Acq.
Acq.
Q3
2020
8
7
6
5
4
3
2
1
Acq.
4
3
2
1
Acq.
3
2
1
Acq.
3
2
1
Acq.
3
2
1
Acq.
2
Acq.
1
Acq.
Acq.
Q4
2020
9
8
7
6
5
4
3
2
1
Acq.
5
4
3
2
1
Acq.
4
3
2
1
Acq.
4
3
2
1
Acq.
4
3
2
1
Acq.
3
2
1
Acq.
2
1
Acq.
1
IL
TN
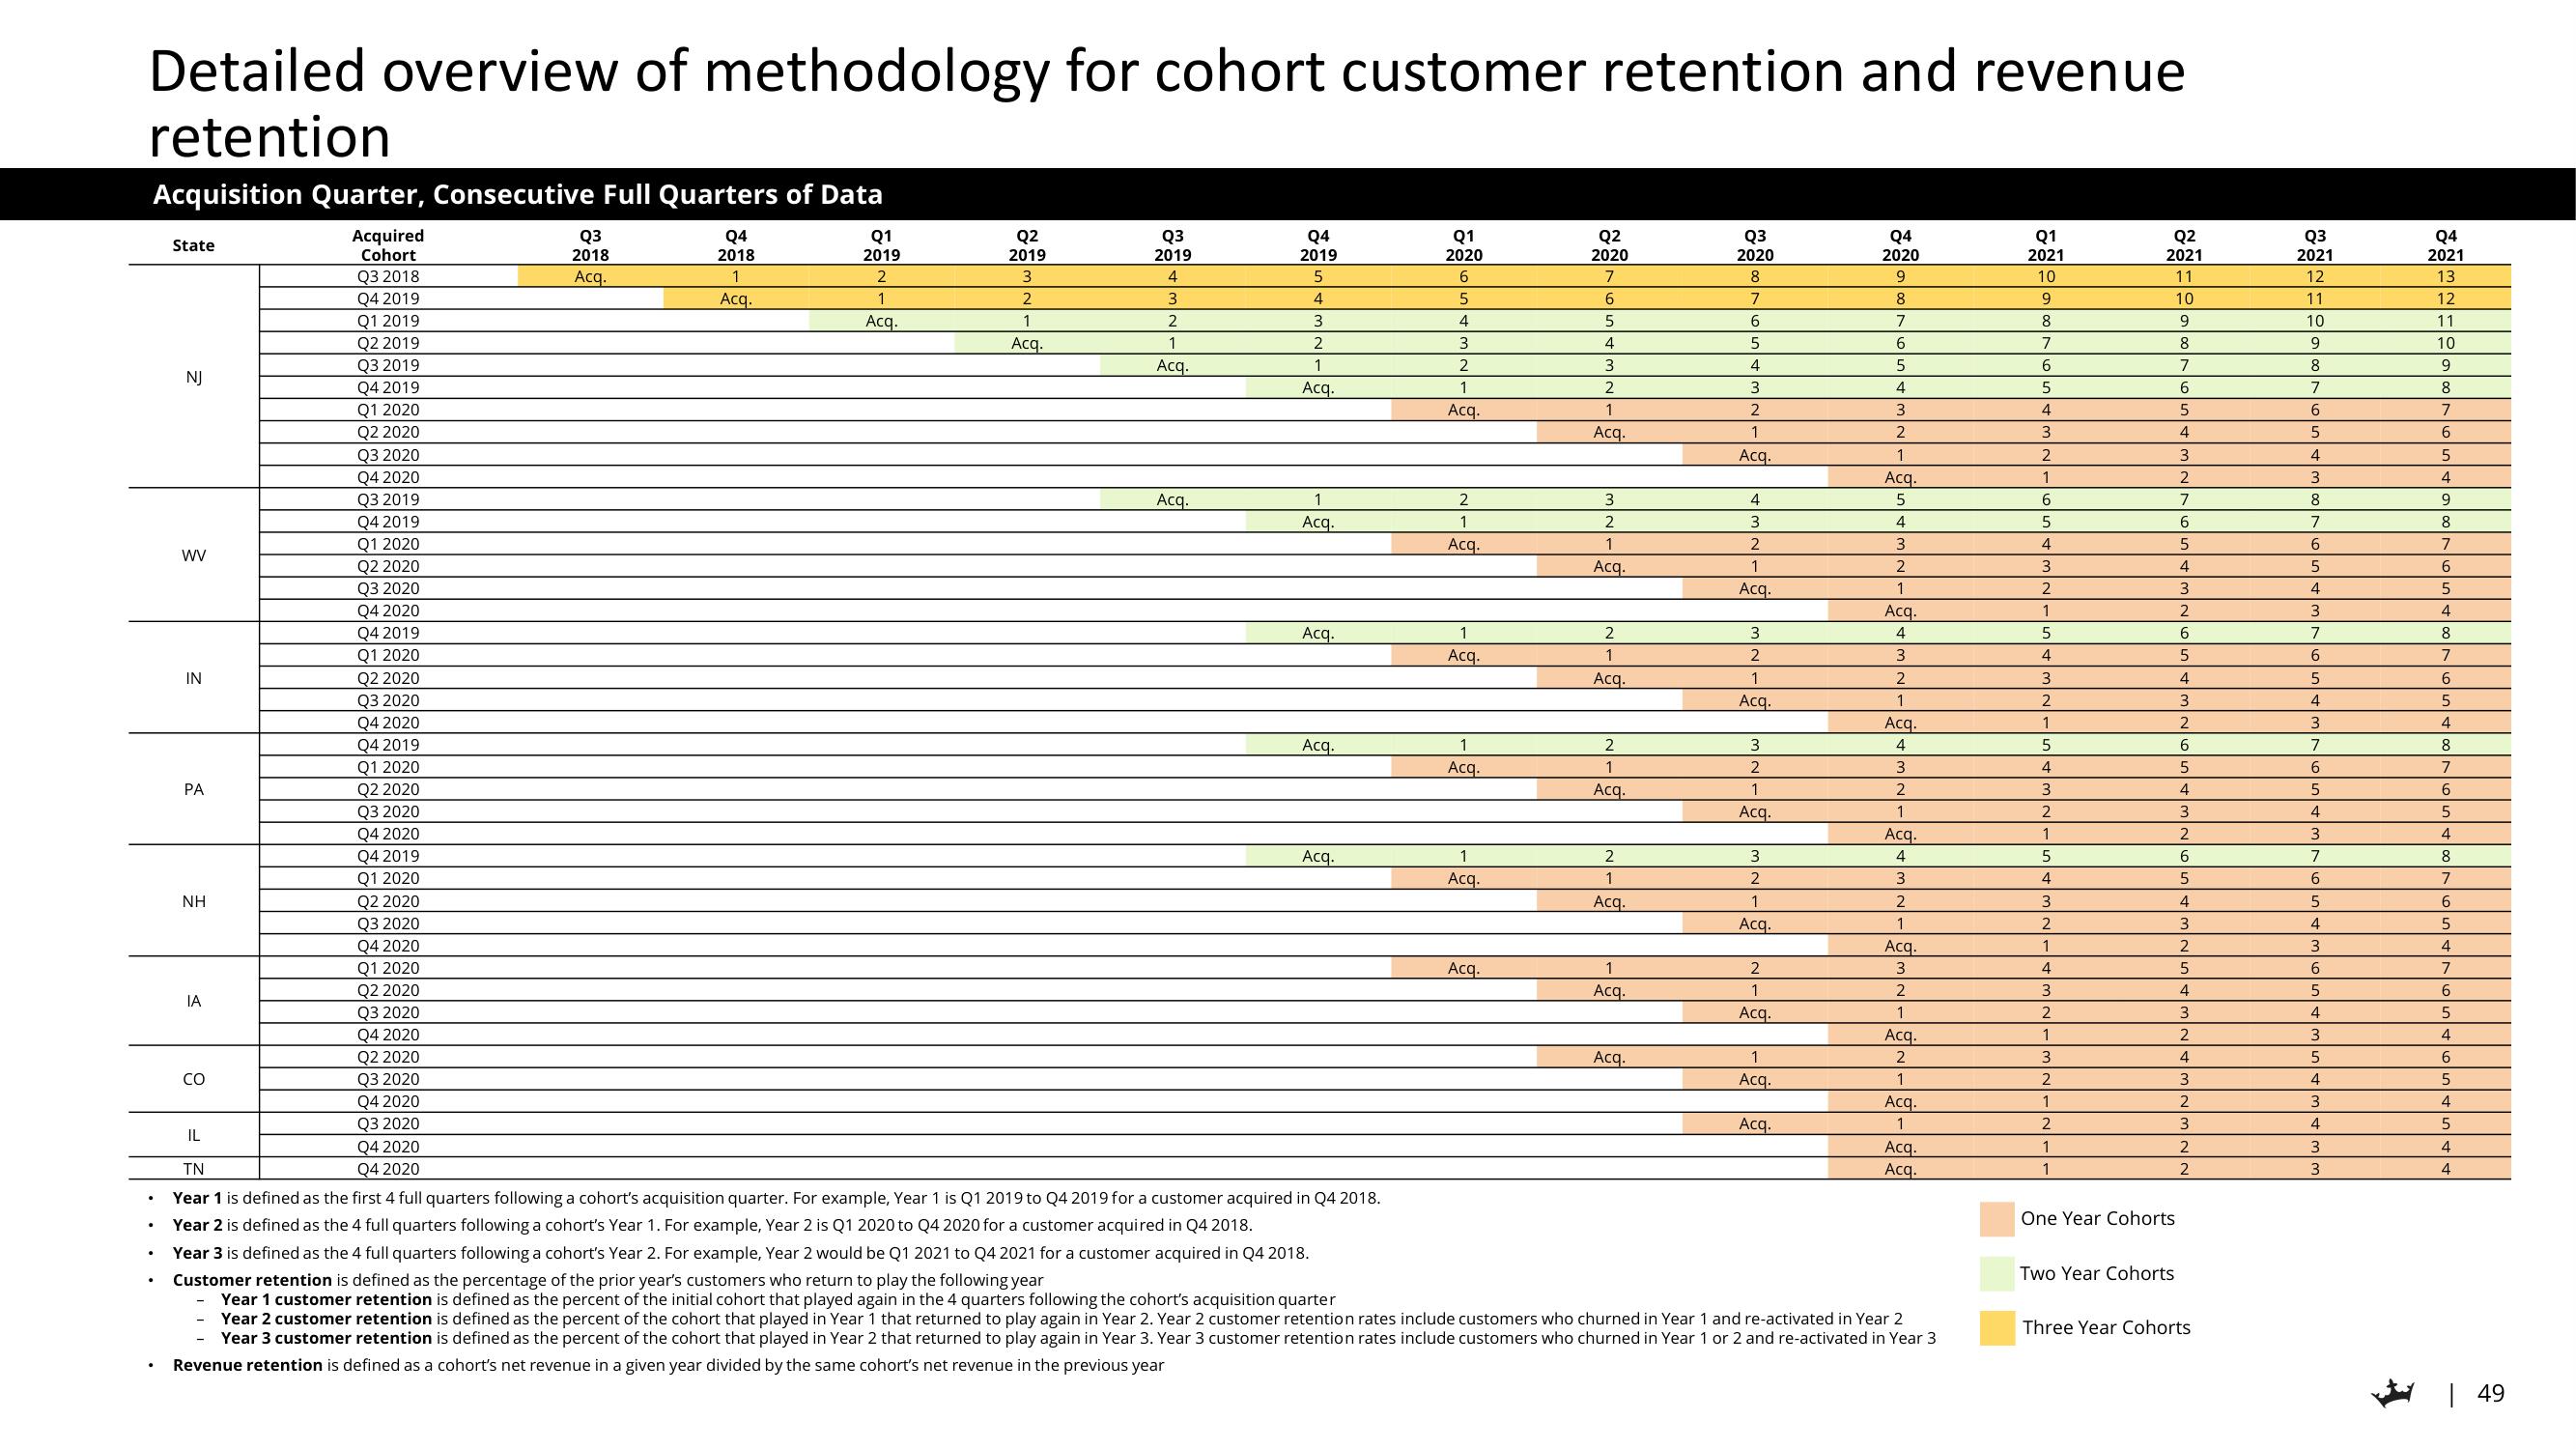
Year 1 is defined as the first 4 full quarters following a cohort's acquisition quarter. For example, Year 1 is Q1 2019 to Q4 2019 for a customer acquired in Q4 2018.
Year 2 is defined as the 4 full quarters following a cohort's Year 1. For example, Year 2 is Q1 2020 to Q4 2020 for a customer acquired in Q4 2018.
Year 3 is defined as the 4 full quarters following a cohort's Year 2. For example, Year 2 would be Q1 2021 to Q4 2021 for a customer acquired in Q4 2018.
Customer retention is defined as the percentage of the prior year's customers who return to play the following year
Year 1 customer retention is defined as the percent of the initial cohort that played again in the 4 quarters following the cohort's acquisition quarter
Year 2 customer retention is defined as the percent of the cohort that played in Year 1 that returned to play again in Year 2. Year 2 customer retention rates include customers who churned in Year 1 and re-activated in Year 2
Year 3 customer retention is defined as the percent of the cohort that played in Year 2 that returned to play again in Year 3. Year 3 customer retention rates include customers who churned in Year 1 or 2 and re-activated in Year 3
Revenue retention is defined as a cohort's net revenue in a given year divided by the same cohort's net revenue in the previous year
Acq.
Acq.
Q1
2021
10
9
8
7
6
5
4
3
2
1
6
5
4
3
2
1
5
4
3
2
1
5
4
3
2
1
5
4
3
2
1
4
3
2
1
3
2
1
2
1
1
Q2
2021
11
10
9
8
7
6
5
4
One Year Cohorts
Two Year Cohorts
3
2
7
6
5
4
3
2
6
5
4
3
2
6
5
4
3
2
6
5
4
3
2
5
4
3
2
4
3
2
3
2
2
Three Year Cohorts
Q3
2021
12
11
10
9
8
7
6
5
4
3
8
7
6
5
4
3
7
6
5
4
3
7
6
5
4
3
7
6
5
4
3
6
5
4
3
5
4
3
4
3
3
Q4
2021
13
12
11
10
9
8
7
6
5
4
9
8
7
6
5
4
8
7
6
5
4
8
7
6
5
4
8
7
6
5
4
7
6
5
4
6
5
4
5
4
4
| 49View entire presentation