Commercial Metals Company Investor Presentation Deck
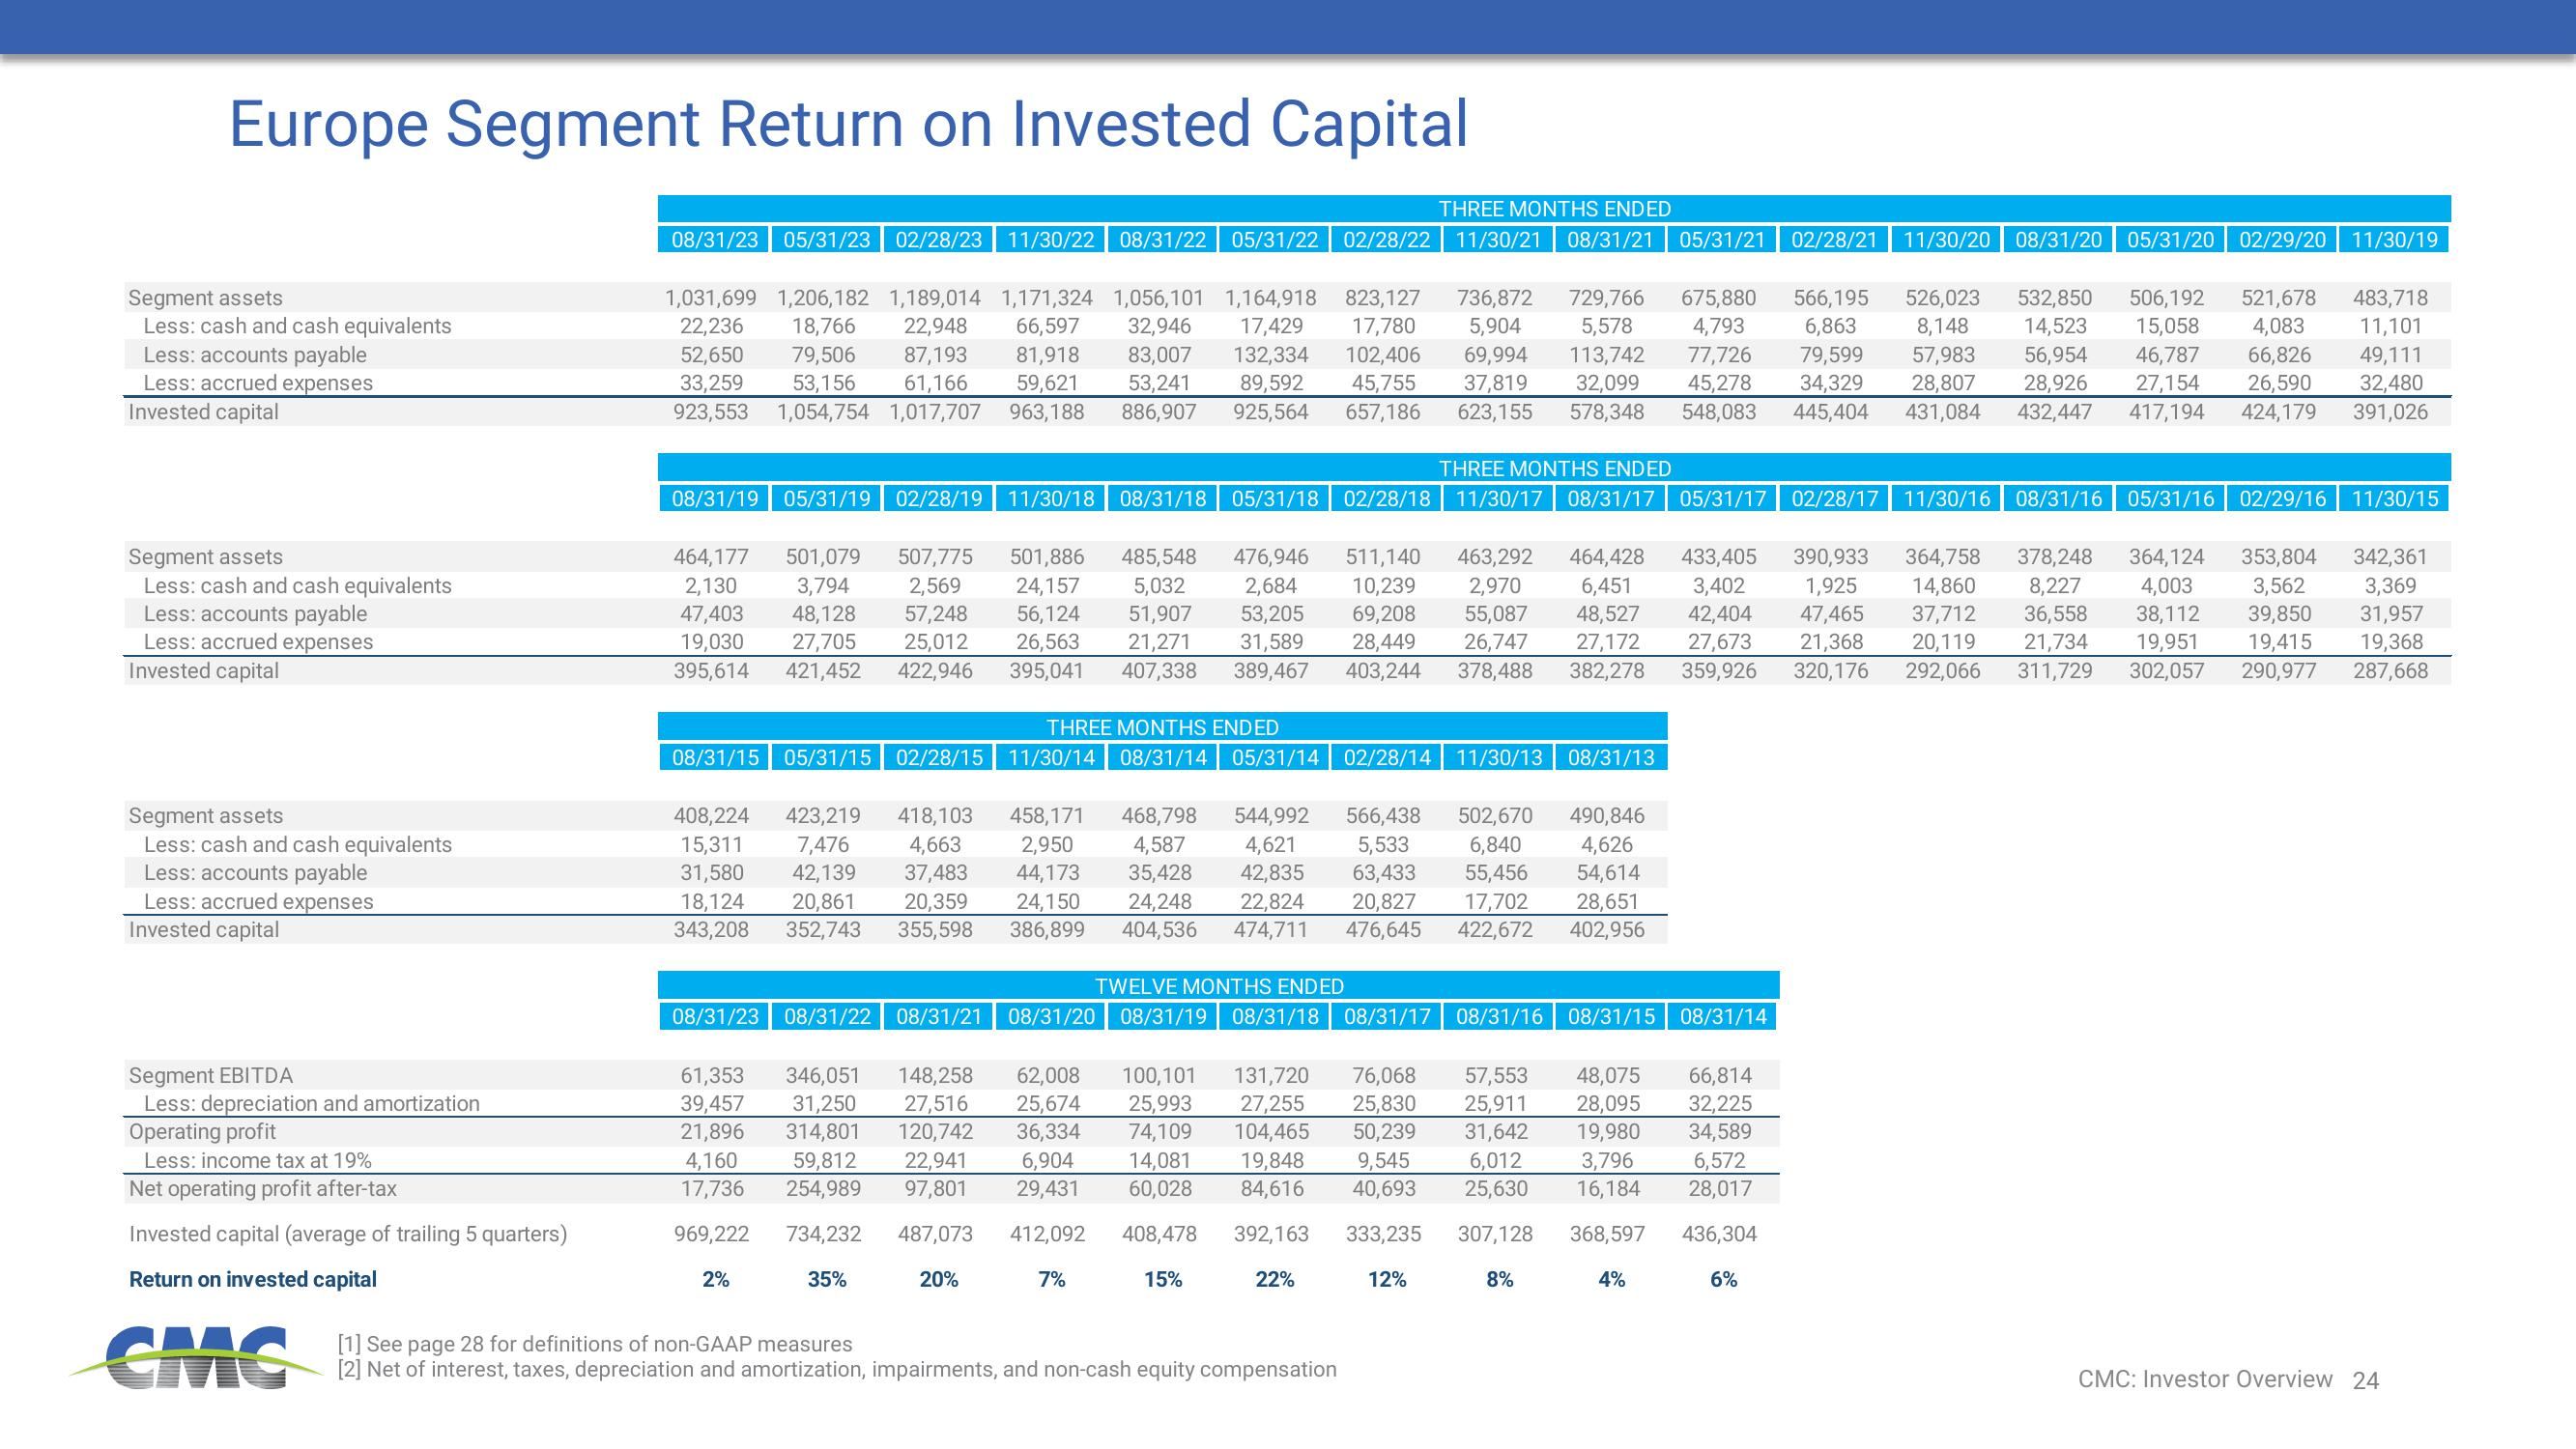
Europe Segment Return on Invested Capital
Segment assets
Less: cash and cash equivalents
Less: accounts payable
Less: accrued expenses
Invested capital
Segment assets
Less: cash and cash equivalents
Less: accounts payable
Less: accrued expenses
Invested capital
Segment assets
Less: cash and cash equivalents
Less: accounts payable
Less: accrued expenses
Invested capital
Segment EBITDA
Less: depreciation and amortization
Operating profit
Less: income tax at 19%
Net operating profit after-tax
Invested capital (average of trailing 5 quarters)
Return on invested capital
CMC
THREE MONTHS ENDED
08/31/23 05/31/23 02/28/23 11/30/22 08/31/22 05/31/22 02/28/22 11/30/21 08/31/21 05/31/21 02/28/21
1,031,699 1,206,182 1,189,014 1,171,324 1,056,101 1,164,918 823,127 736,872 729,766 675,880 566,195 526,023 532,850 506,192 521,678 483,718
22,236 18,766 22,948 66,597 32,946 17,429 17,780 5,904 5,578 4,793 6,863 8,148 14,523 15,058 4,083 11,101
52,650 79,506 87,193 81,918 83,007 132,334 102,406 69,994 113,742 77,726 79,599 57,983 56,954 46,787 66,826
33,259 53,156 61,166 59,621 53,241 89,592 45,755 37,819 32,099 45,278 34,329 28,807 28,926 27,154 26,590
886,907 925,564 657,186 623,155 578,348 548,083 445,404 431,084 432,447 417,194 424,179
49,111
32,480
391,026
923,553 1,054,754 1,017,707 963,188
08/31/19 05/31/19 02/28/19
464,177
2,130
47,403
19,030
395,614
501,079 507,775
3,794 2,569
48,128 57,248
27,705 25,012
421,452 422,946
08/31/15 05/31/15 02/28/15
08/31/23 08/31/22 08/31/21
11/30/18
20%
08/31/18
05/31/18
408,224 423,219 418,103 458,171 468,798 544,992 566,438 502,670 490,846
15,311 7,476
,663 2,950 4,587 4,621 5,533
6,840
31,580 42,139 37,483 44,173 35,428 42,835 63,433 55,456
18,124 20,861 20,359 24,150 24,248 22,824 20,827 17,702
343,208 352,743 355,598 386,899 404,536 474,711 476,645 422,672
08/31/20
61,353 346,051 148,258 62,008
39,457 31,250 27,516 25,674
21,896 314,801 120,742 36,334
4,160 59,812 22,941 6,904
17,736 254,989 97,801 29,431
969,222 734,232 487,073
35%
412,092
7%
2%
501,886 485,548 476,946 511,140 463,292 464,428 433,405 390,933 364,758
24,157 5,032 2,684 10,239 2,970 6,451 3,402 1,925 14,860
56,124 51,907 53,205 69,208 55,087 48,527 42,404 47,465 37,712
26,563
21,271 31,589 28,449 26,747 27,172 27,673 21,368 20,119
395,041 407,338 389,467 403,244 378,488 382,278 359,926 320,176 292,066
THREE MONTHS ENDED
11/30/14 08/31/14 05/31/14 02/28/14 11/30/13 08/31/13
THREE MONTHS ENDED
02/28/18 11/30/17 08/31/17 05/31/17 02/28/17 11/30/16
TWELVE MONTHS ENDED
08/31/19 08/31/18 08/31/17 08/31/16
[1] See page 28 for definitions of non-GAAP measures
[2] Net of interest, taxes, depreciation and amortization, impairments, and non-cash equity compensation
54,614
28,651
402,956
11/30/20 08/31/20 05/31/20 02/29/20 11/30/19
08/31/15
08/31/14
100,101 131,720 76,068 57,553 48,075 66,814
25,993 27,255 25,830 25,911 28,095 32,225
74,109 104,465 50,239 31,642 19,980 34,589
14,081 19,848 9,545
6,012 3,796 6,572
60,028 84,616 40,693 25,630 16,184 28,017
408,478 392,163 333,235 307,128 368,597
15%
12%
8%
4%
436,304
22%
6%
08/31/16 05/31/16 02/29/16 11/30/15
378,248 364,124 353,804 342,361
8,227 4,003 3,562 3,369
36,558 38,112 39,850 31,957
21,734 19,951 19,415 19,368
311,729
302,057 290,977 287,668
CMC: Investor Overview 24View entire presentation