Tradeweb Investor Presentation Deck
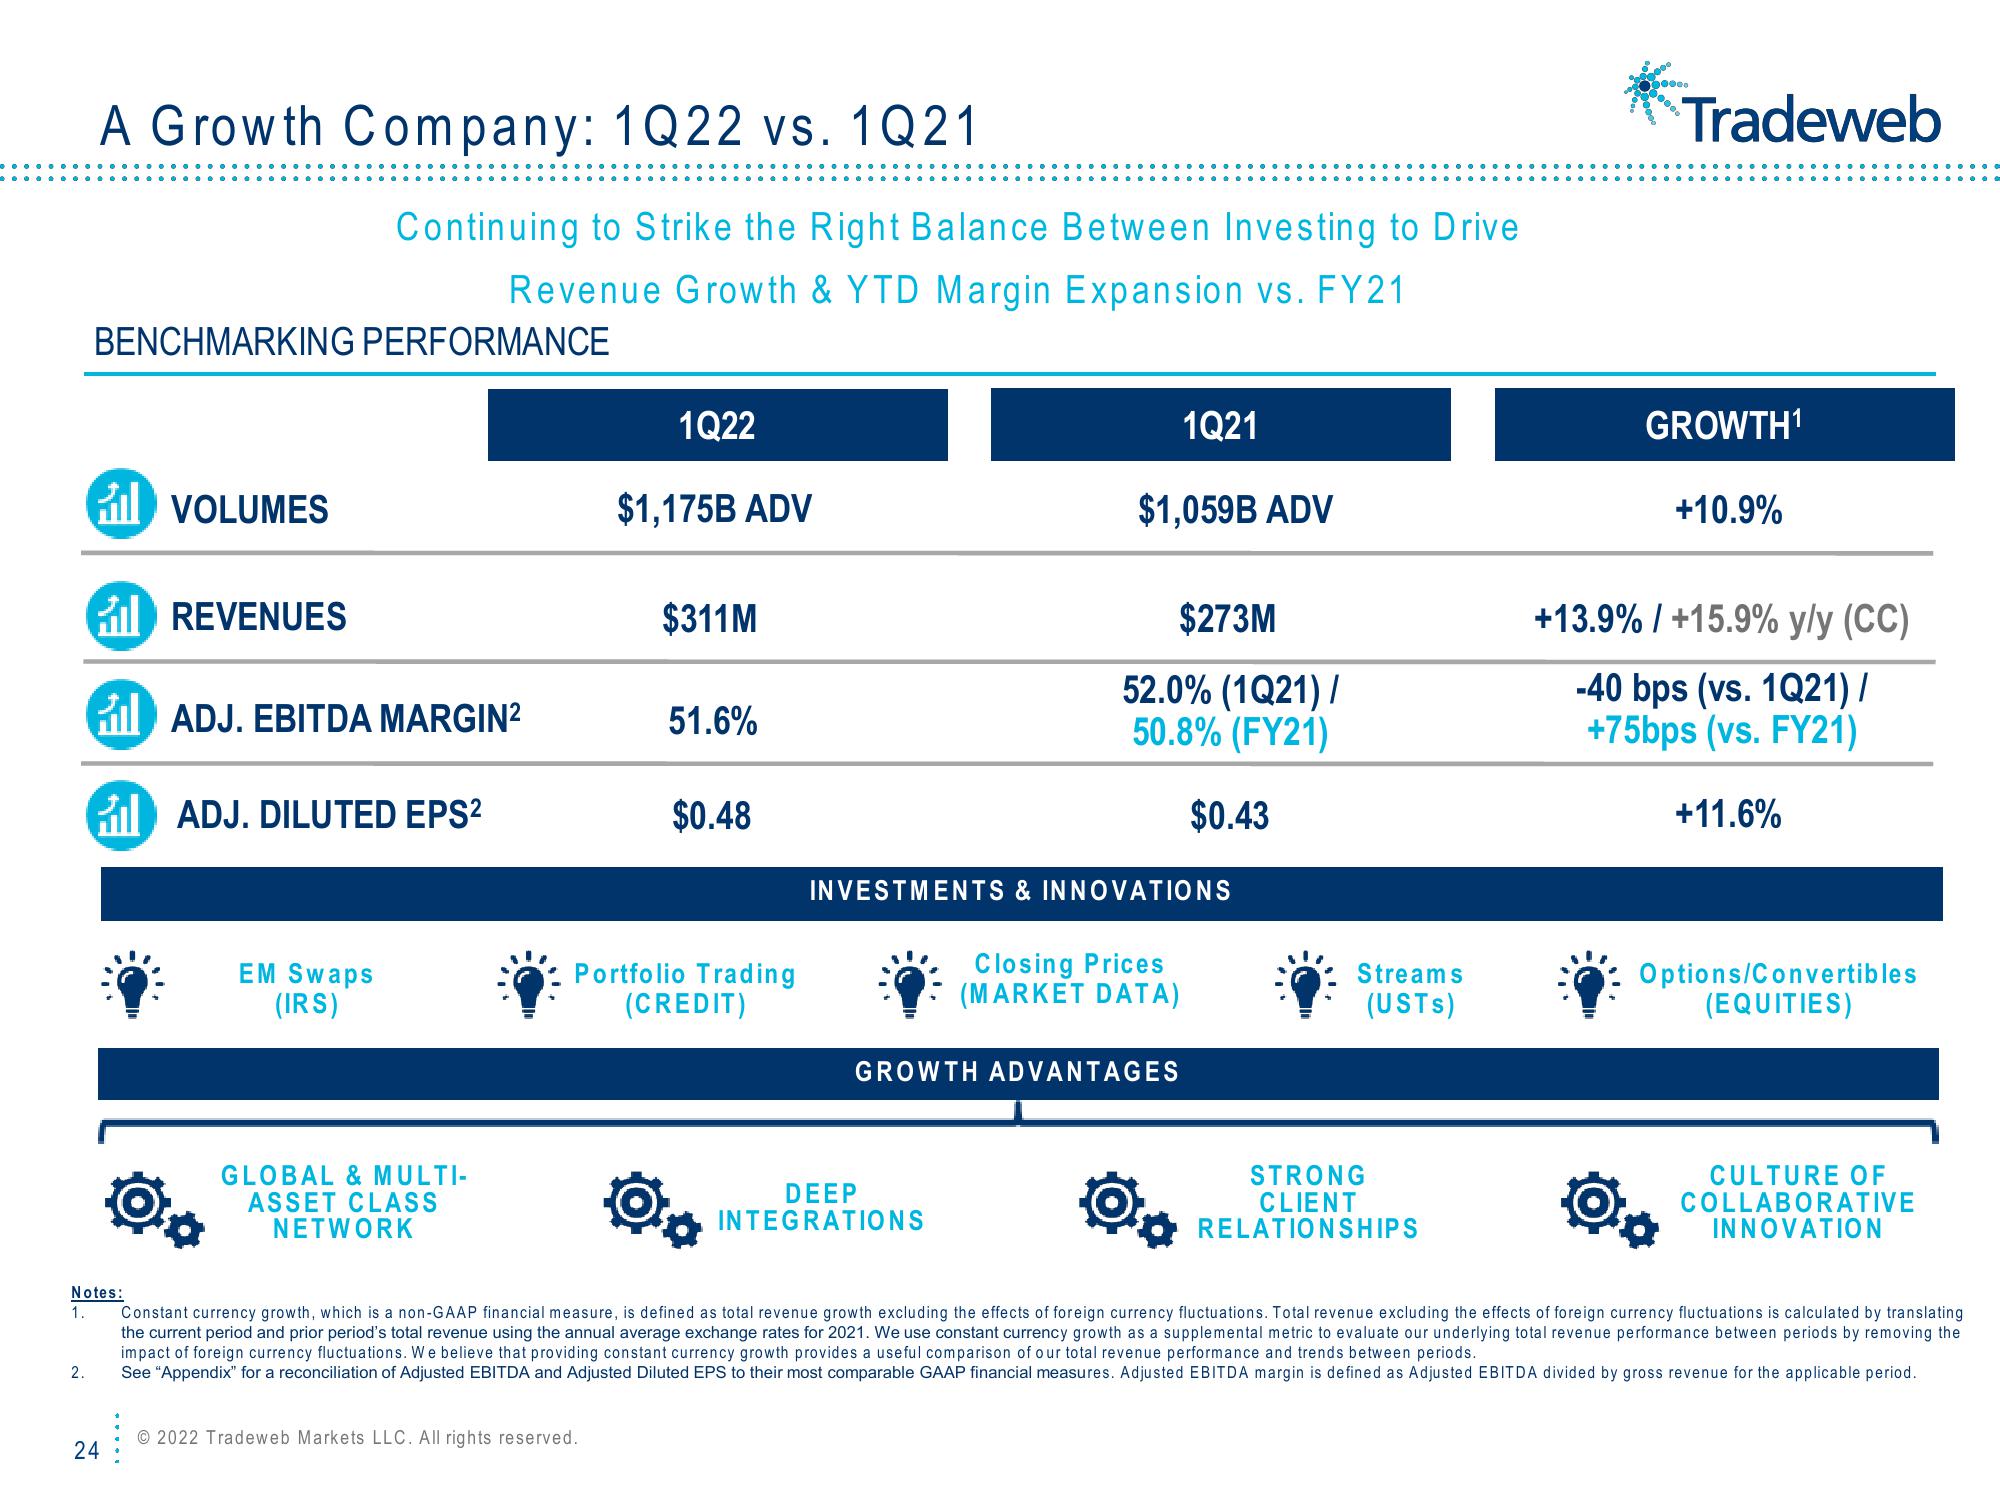
A Growth Company: 1Q22 vs. 1Q21
2.
BENCHMARKING PERFORMANCE
il VOLUMES
24
Notes:
1.
Continuing to Strike the Right Balance Between Investing to Drive
Revenue Growth & YTD Margin Expansion vs. FY21
il REVENUES
il ADJ. EBITDA MARGIN²
ADJ. DILUTED EPS²
EM Swaps
(IRS)
GLOBAL & MULTI-
ASSET CLASS
NETWORK
1Q22
$1,175B ADV
Ⓒ2022 Tradeweb Markets LLC. All rights reserved.
$311M
51.6%
$0.48
Portfolio Trading
(CREDIT)
1Q21
$1,059B ADV
$273M
52.0% (1Q21) /
50.8% (FY21)
DEEP
INTEGRATIONS
INVESTMENTS & INNOVATIONS
Closing Prices
(MARKET DATA)
GROWTH ADVANTAGES
$0.43
Streams
(USTS)
STRONG
CLIENT
RELATIONSHIPS
Tradeweb
GROWTH¹
+10.9%
+13.9% / +15.9% y/y (CC)
-40 bps (vs. 1Q21) /
+75bps (vs. FY21)
+11.6%
Options/Convertibles
(EQUITIES)
*
Constant currency growth, which is a non-GAAP financial measure, is defined as total revenue growth excluding the effects of foreign currency fluctuations. Total revenue excluding the effects of foreign currency fluctuations is calculated by translating
the current period and prior period's total revenue using the annual average exchange rates for 2021. We use constant currency growth as a supplemental metric to evaluate our underlying total revenue performance between periods by removing the
impact of foreign currency fluctuations. We believe that providing constant currency growth provides a useful comparison of our total revenue performance and trends between periods.
See "Appendix" for a reconciliation of Adjusted EBITDA and Adjusted Diluted EPS to their most comparable GAAP financial measures. Adjusted EBITDA margin is defined as Adjusted EBITDA divided by gross revenue for the applicable period.
CULTURE OF
COLLABORATIVE
INNOVATIONView entire presentation