Marti Results Presentation Deck
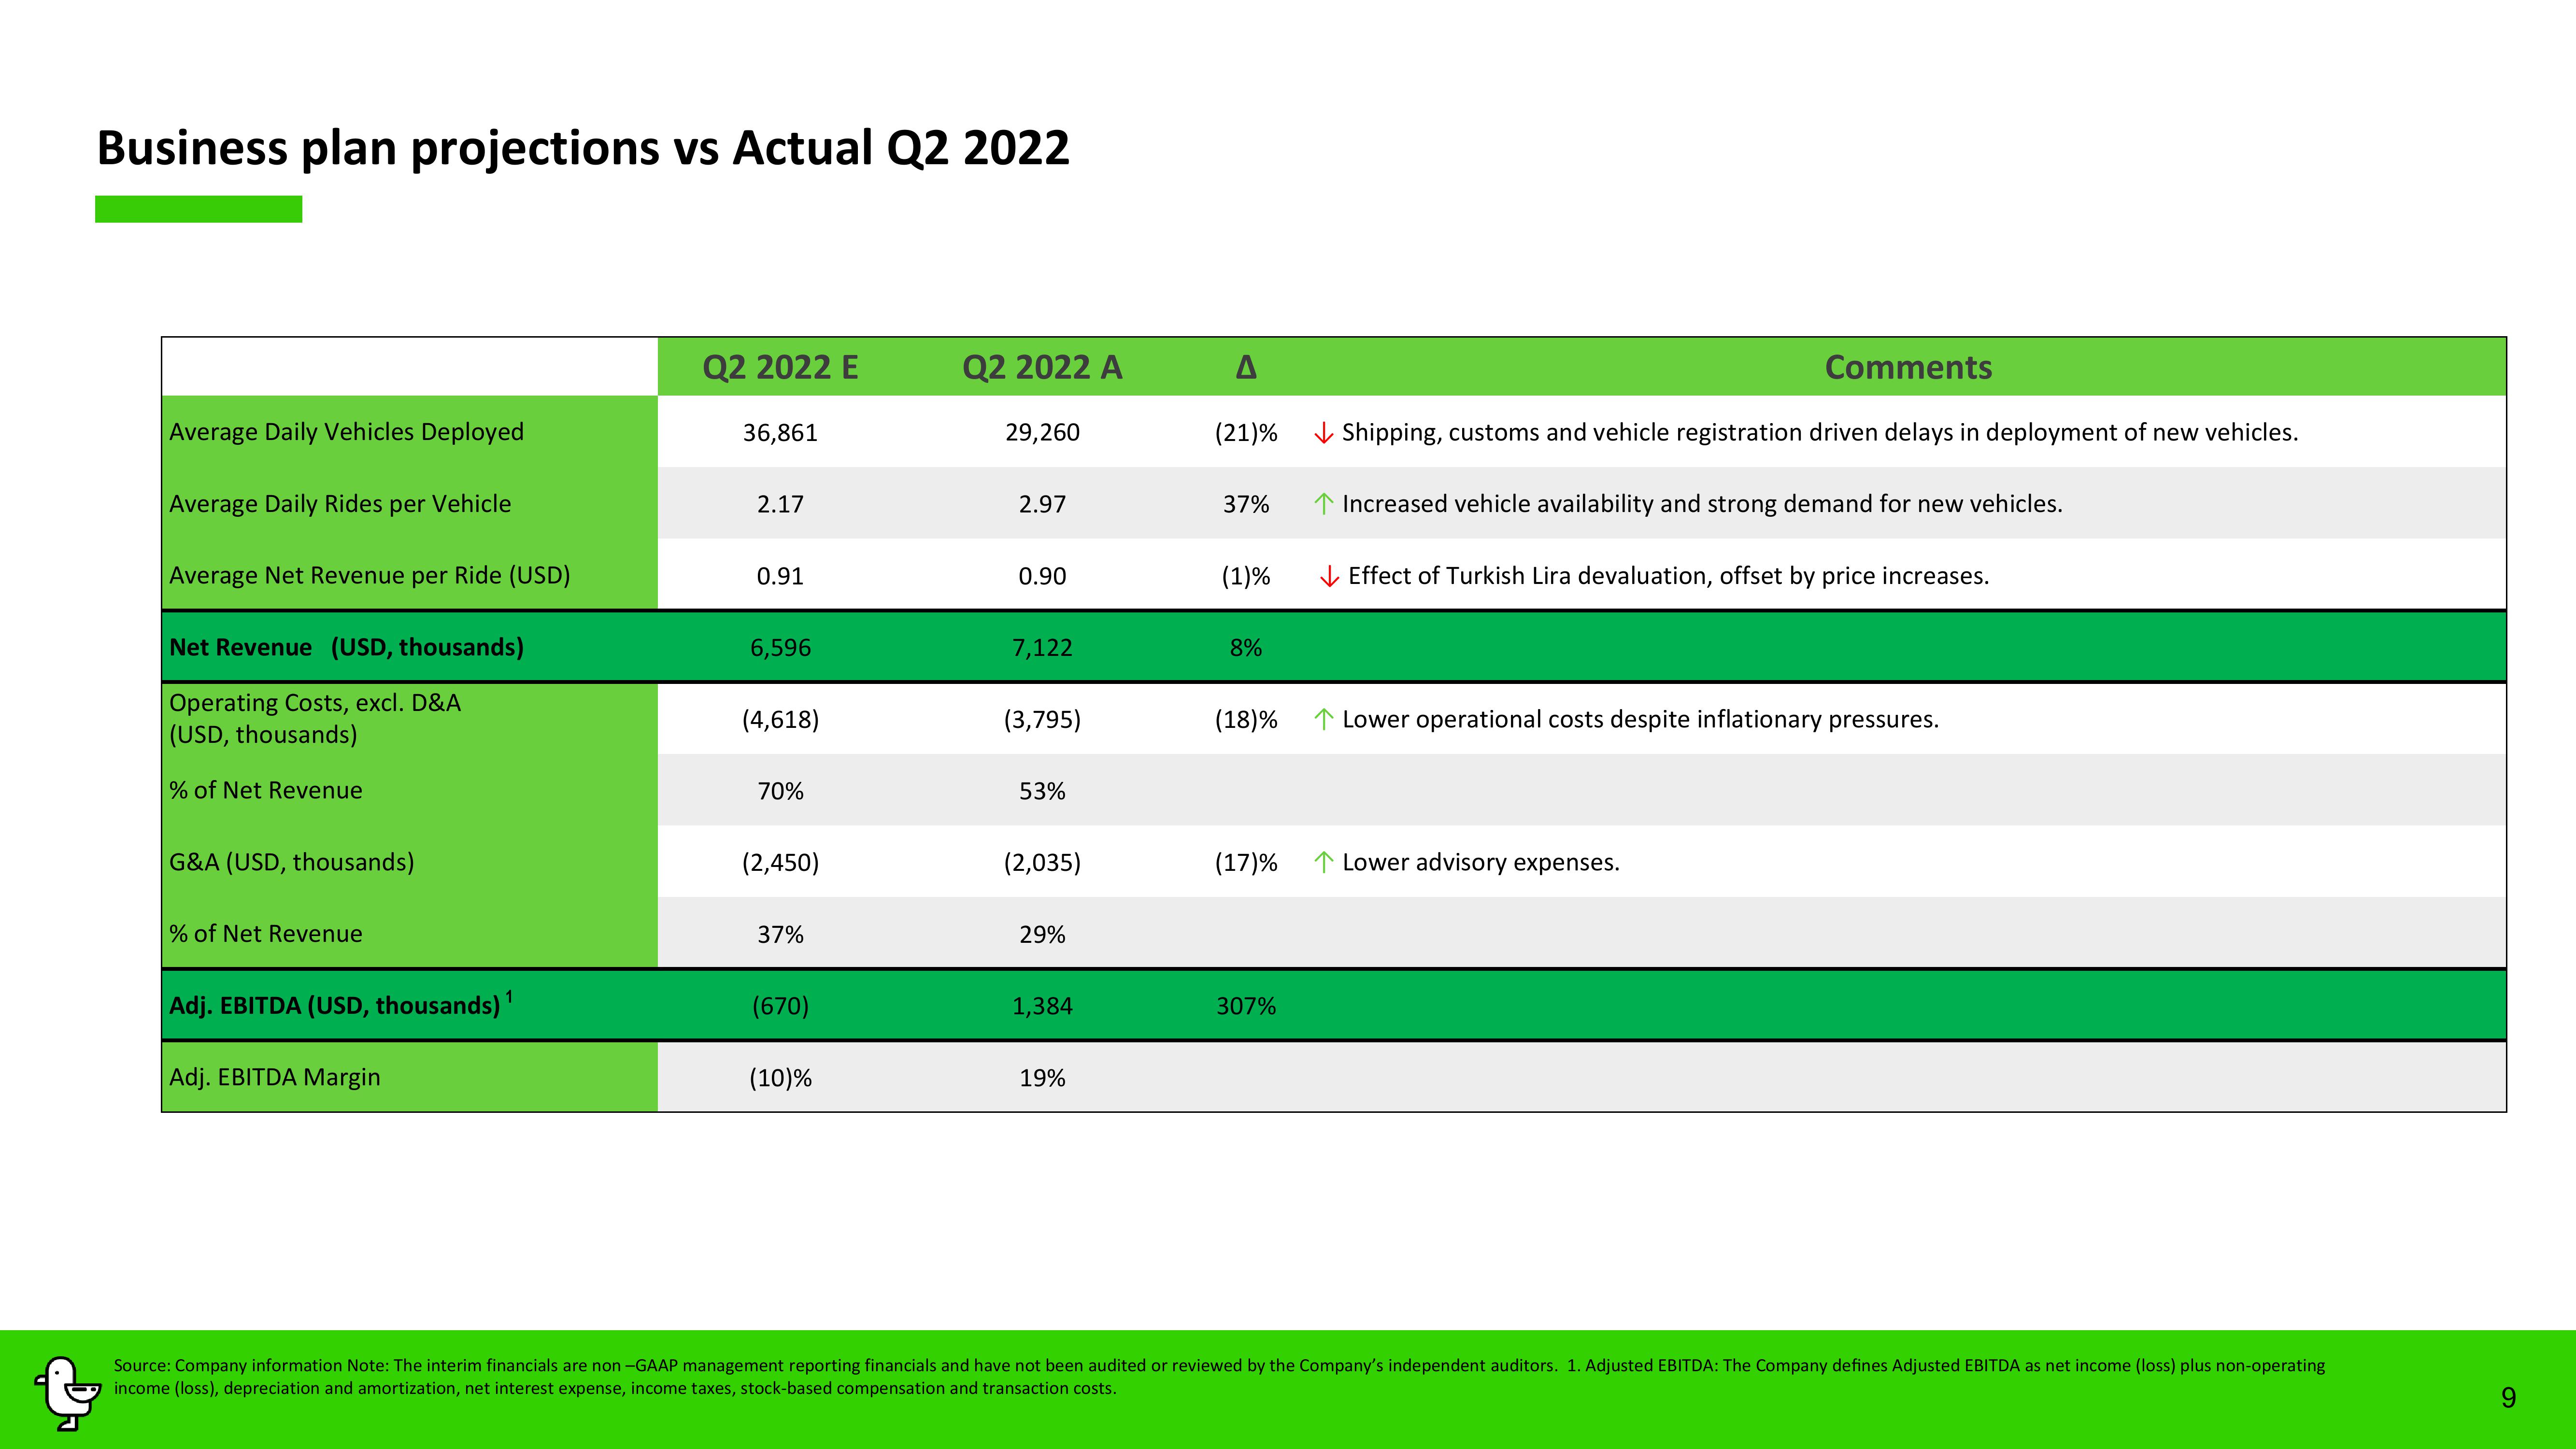
Business plan projections vs Actual Q2 2022
Average Daily Vehicles Deployed
Average Daily Rides per Vehicle
Average Net Revenue per Ride (USD)
Net Revenue (USD, thousands)
Operating Costs, excl. D&A
(USD, thousands)
% of Net Revenue
G&A (USD, thousands)
% of Net Revenue
Adj. EBITDA (USD, thousands)
Adj. EBITDA Margin
Q2 2022 E
36,861
2.17
0.91
6,596
(4,618)
70%
(2,450)
37%
(670)
(10)%
Q2 2022 A
29,260
2.97
0.90
7,122
(3,795)
53%
(2,035)
29%
1,384
19%
A
(21)%
37%
(1)%
8%
(18)%
(17)%
307%
Comments
Shipping, customs and vehicle registration driven delays in deployment of new vehicles.
↑ Increased vehicle availability and strong demand for new vehicles.
✓ Effect of Turkish Lira devaluation, offset by price increases.
↑ Lower operational costs despite inflationary pressures.
↑ Lower advisory expenses.
Source: Company information Note: The interim financials are non-GAAP management reporting financials and have not been audited or reviewed by the Company's independent auditors. 1. Adjusted EBITDA: The Company defines Adjusted EBITDA as net income (loss) plus non-operating
income (loss), depreciation and amortization, net interest expense, income taxes, stock-based compensation and transaction costs.
9View entire presentation