Ready Capital Investor Presentation Deck
SBC Lending and Acquisitions
ACQUIRED
TRANSITIONAL
FIXED/CMBS(6)
AGENCY
LOAN COUNT(1)
2,608
1,868
433
291
16
UPB
$6.76B
$1.20B
$4.43B
$1.09B
$43M
CURRENT QUARTER HIGHLIGHTS
BOOK VALUE
1. Excludes joint venture investments
2. 56.9% of fixed rate loans match funded
$6.71B
$1.19B
$4.39B
$1.09B
$44M
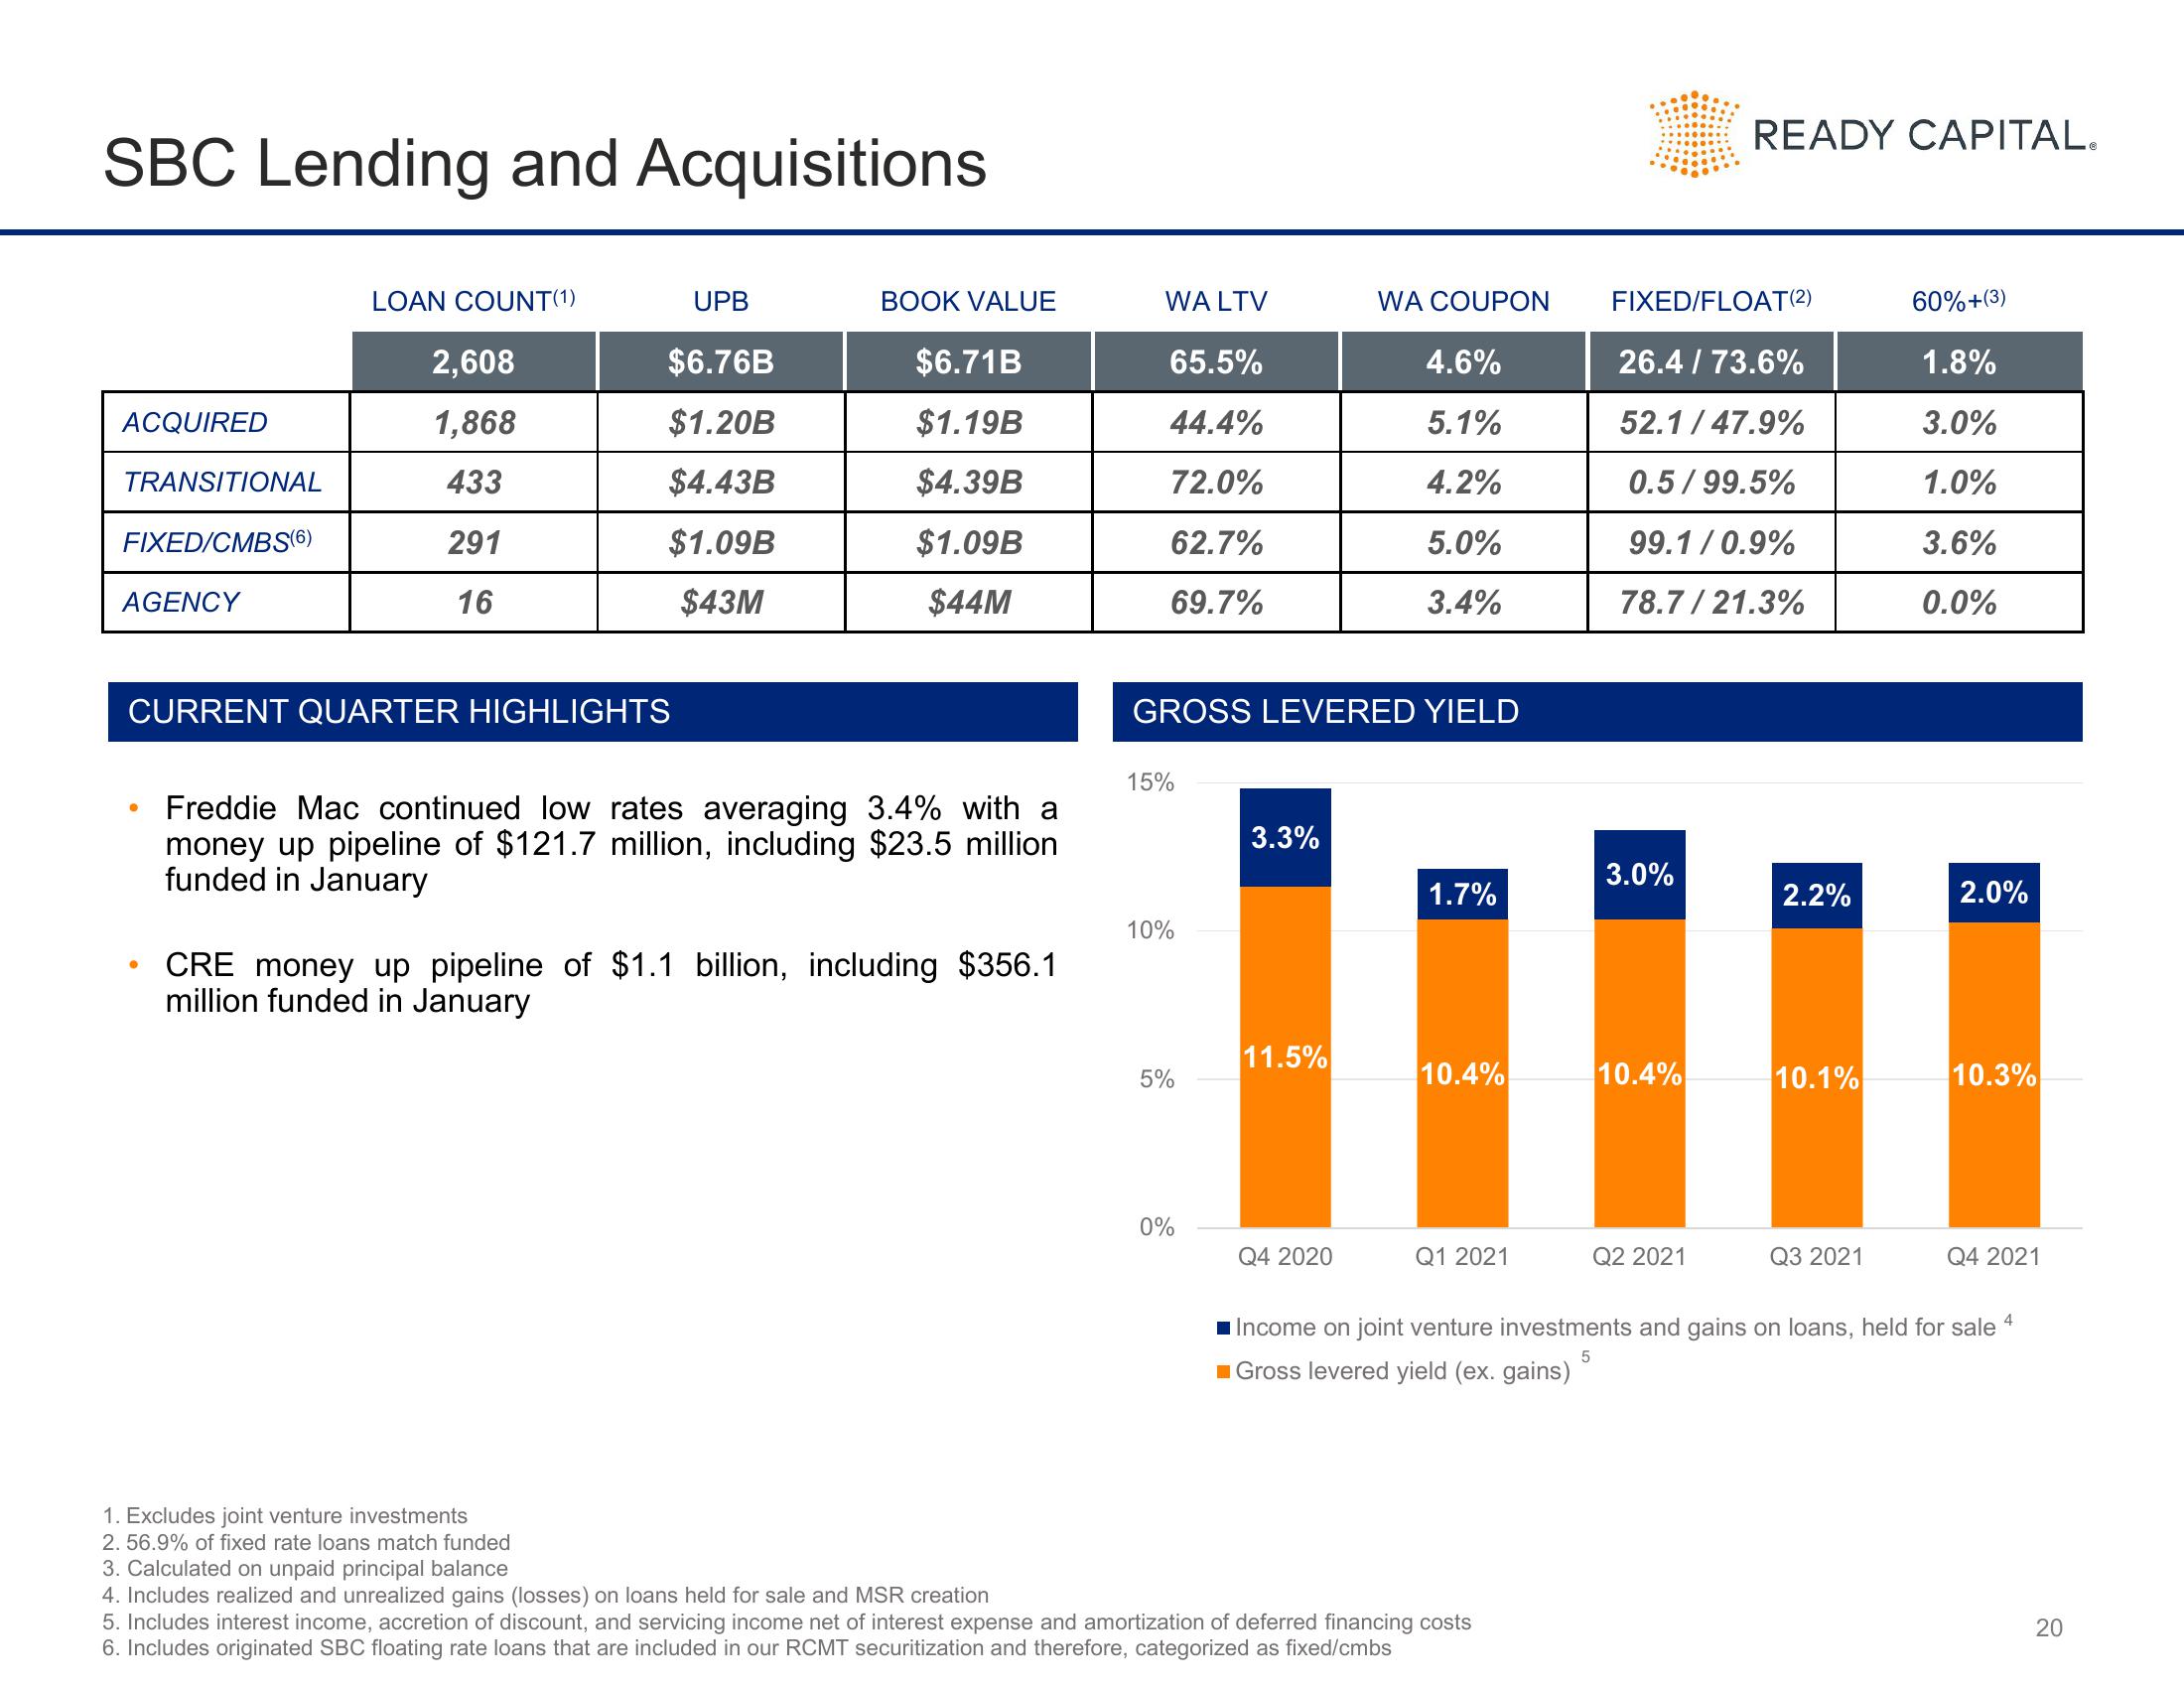
Freddie Mac continued low rates averaging 3.4% with a
money up pipeline of $121.7 million, including $23.5 million
funded in January
CRE money up pipeline of $1.1 billion, including $356.1
million funded in January
WA LTV
65.5%
44.4%
72.0%
62.7%
69.7%
15%
GROSS LEVERED YIELD
10%
5%
0%
3.3%
11.5%
WA COUPON
Q4 2020
4.6%
5.1%
4.2%
5.0%
3.4%
1.7%
10.4%
Q1 2021
3. Calculated on unpaid principal balance
4. Includes realized and unrealized gains (losses) on loans held for sale and MSR creation
5. Includes interest income, accretion of discount, and servicing income net of interest expense and amortization of deferred financing costs
6. Includes originated SBC floating rate loans that are included in our RCMT securitization and therefore, categorized as fixed/cmbs
FIXED/FLOAT(2)
26.4 / 73.6%
52.1/47.9%
0.5/99.5%
99.1/0.9%
78.7/21.3%
3.0%
10.4%
READY CAPITAL.
Q2 2021
2.2%
10.1%
Q3 2021
60%+(3)
1.8%
3.0%
1.0%
3.6%
0.0%
2.0%
10.3%
Q4 2021
4
Income on joint venture investments and gains on loans, held for sale
Gross levered yield (ex. gains)
5
20View entire presentation