Allwyn Investor Conference Presentation Deck
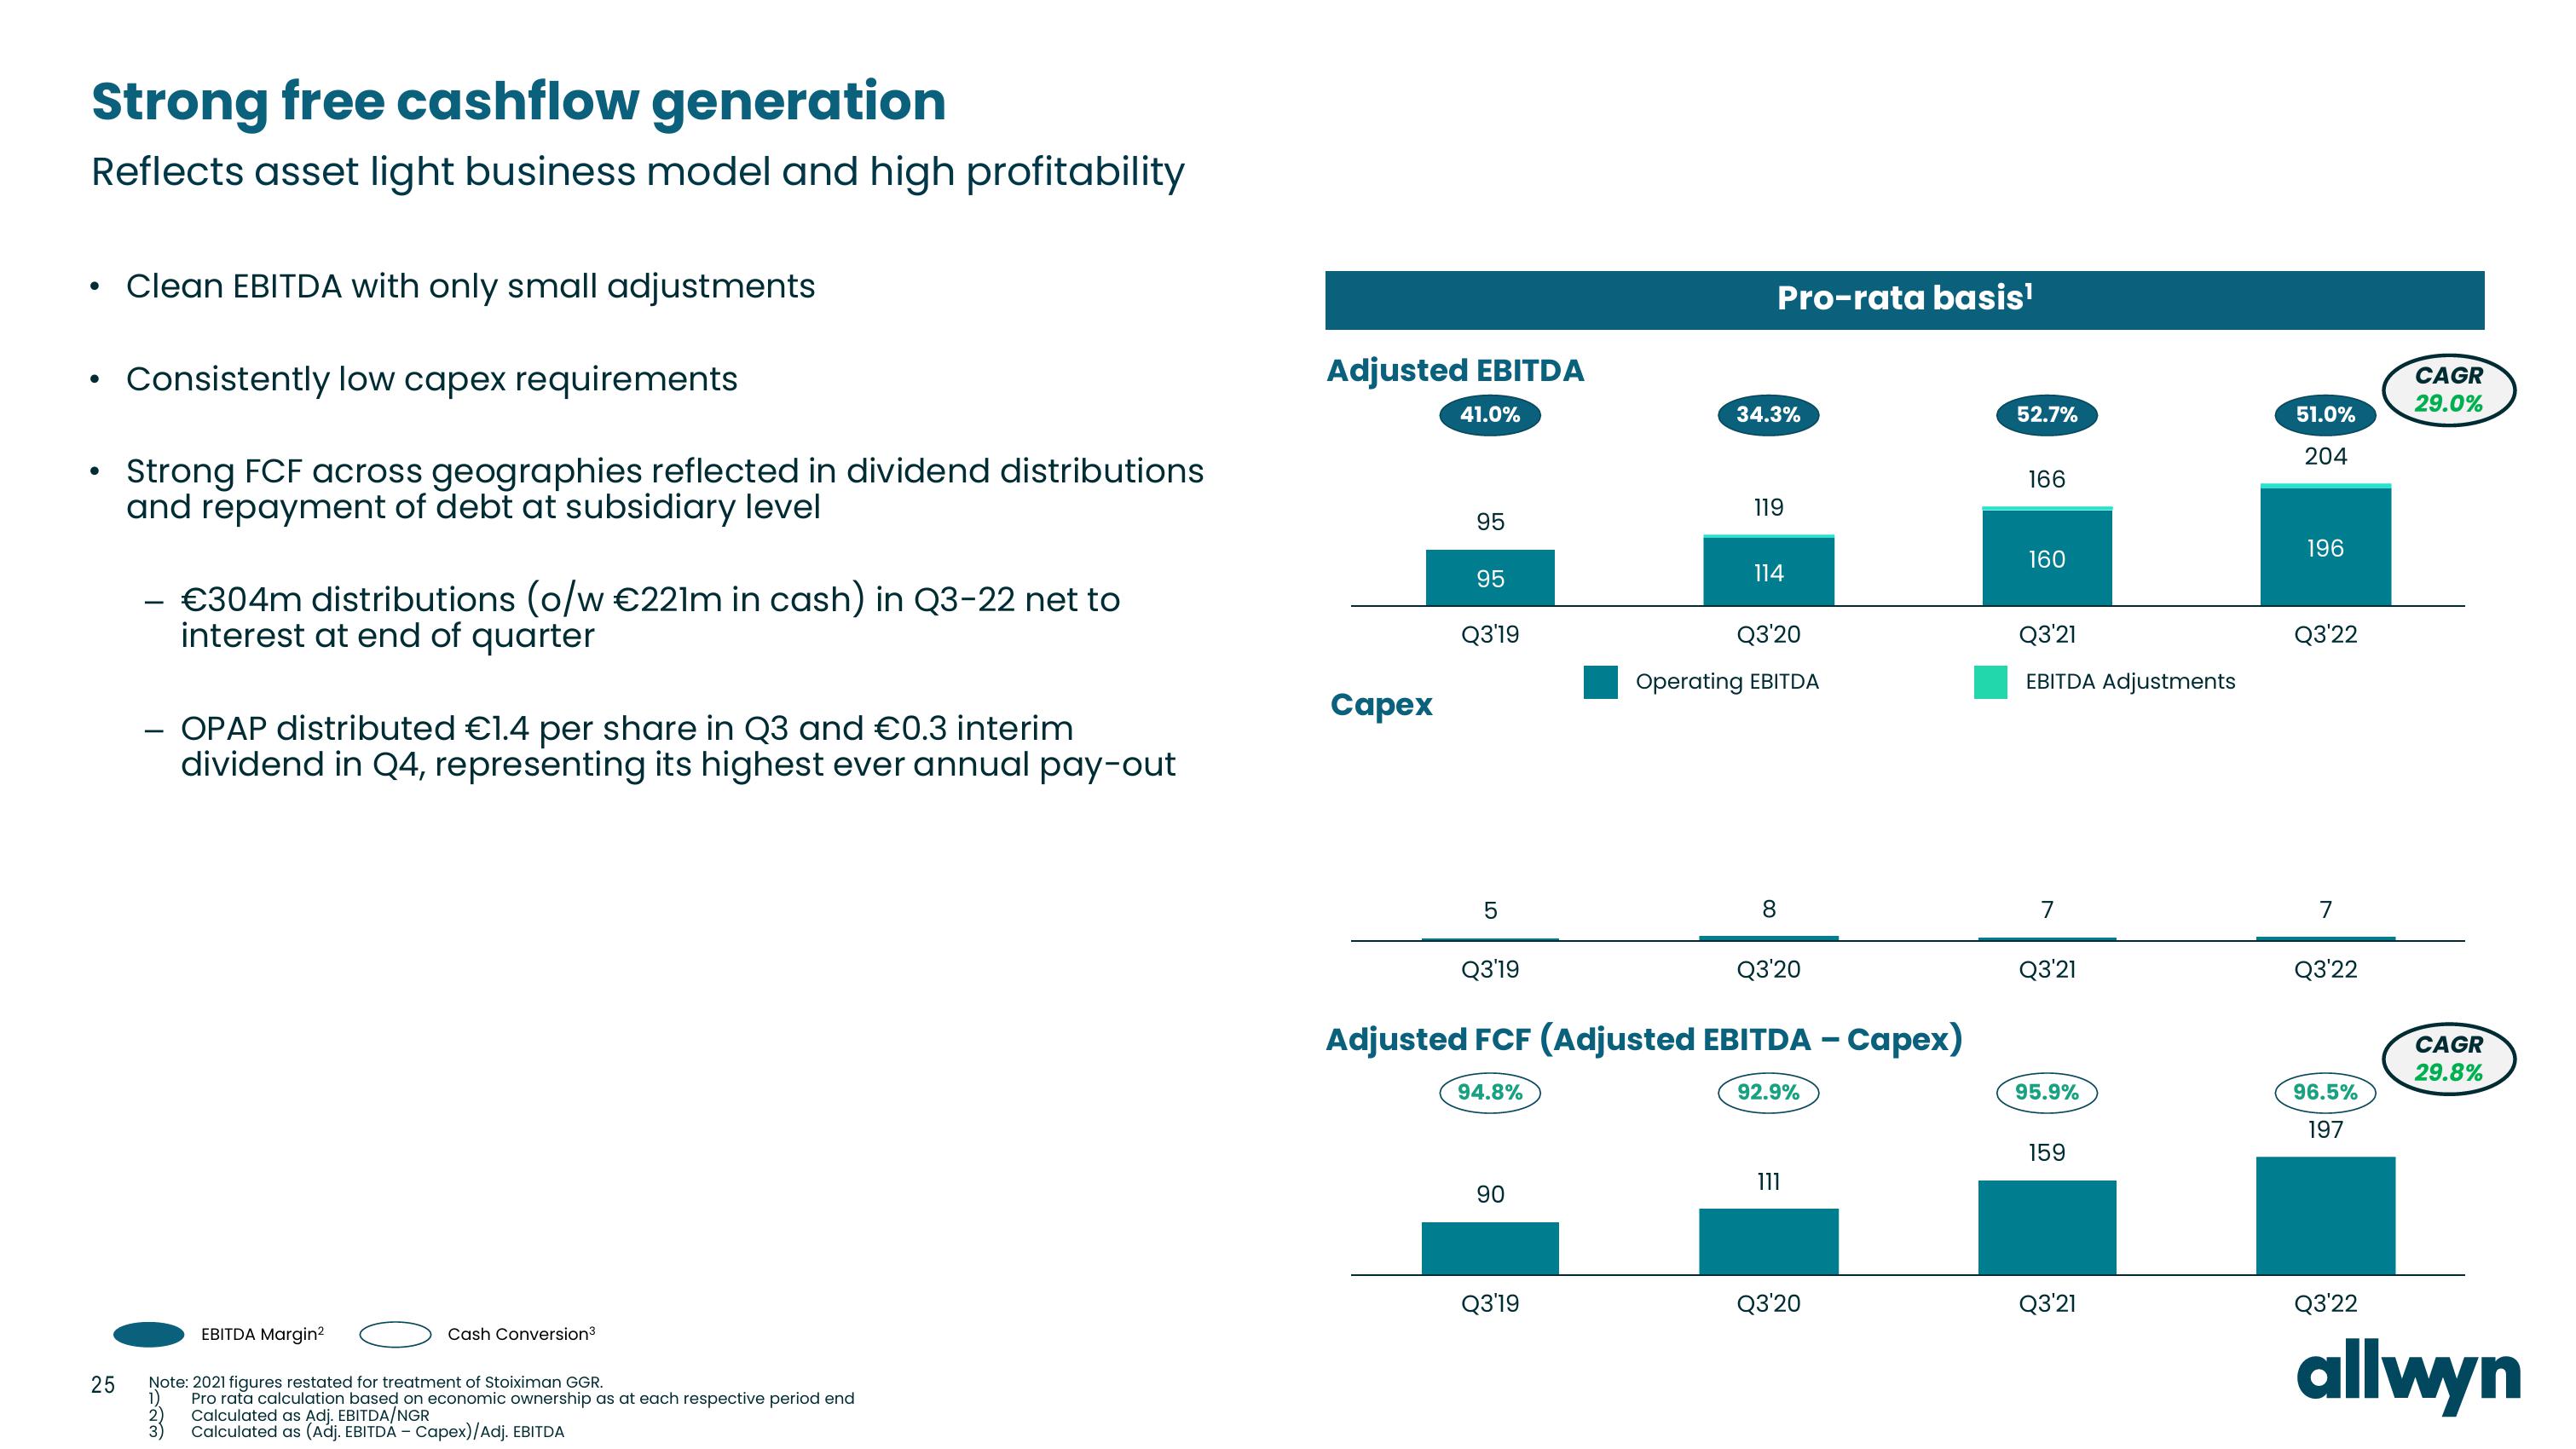
Strong free cashflow generation
Reflects asset light business model and high profitability
• Clean EBITDA with only small adjustments
Consistently low capex requirements
Strong FCF across geographies reflected in dividend distributions
and repayment of debt at subsidiary level
●
25
– €304m distributions (o/w €221m in cash) in Q3-22 net to
interest at end of quarter
OPAP distributed €1.4 per share in Q3 and €0.3 interim
dividend in Q4, representing its highest ever annual pay-out
EBITDA Margin²
Cash Conversion³
Note: 2021 figures restated for treatment of Stoiximan GGR.
1) Pro rata calculation based on economic ownership as at each respective period end
Calculated as Adj. EBITDA/NGR
Calculated as (Adj. EBITDA - Capex)/Adj. EBITDA
Adjusted EBITDA
Capex
41.0%
95
95
Q3'19
5
Q3'19
90
Pro-rata basis¹
Q3'19
34.3%
8
Q3'20
Adjusted FCF (Adjusted EBITDA - Capex)
94.8%
92.9%
119
114
Q3'20
Operating EBITDA
111
Q3'20
52.7%
166
160
Q3'21
EBITDA Adjustments
7
Q3'21
95.9%
159
Q3'21
51.0%
204
196
Q3'22
7
Q3'22
96.5%
197
Q3'22
CAGR
29.0%
CAGR
29.8%
allwynView entire presentation