First Merchants Results Presentation Deck
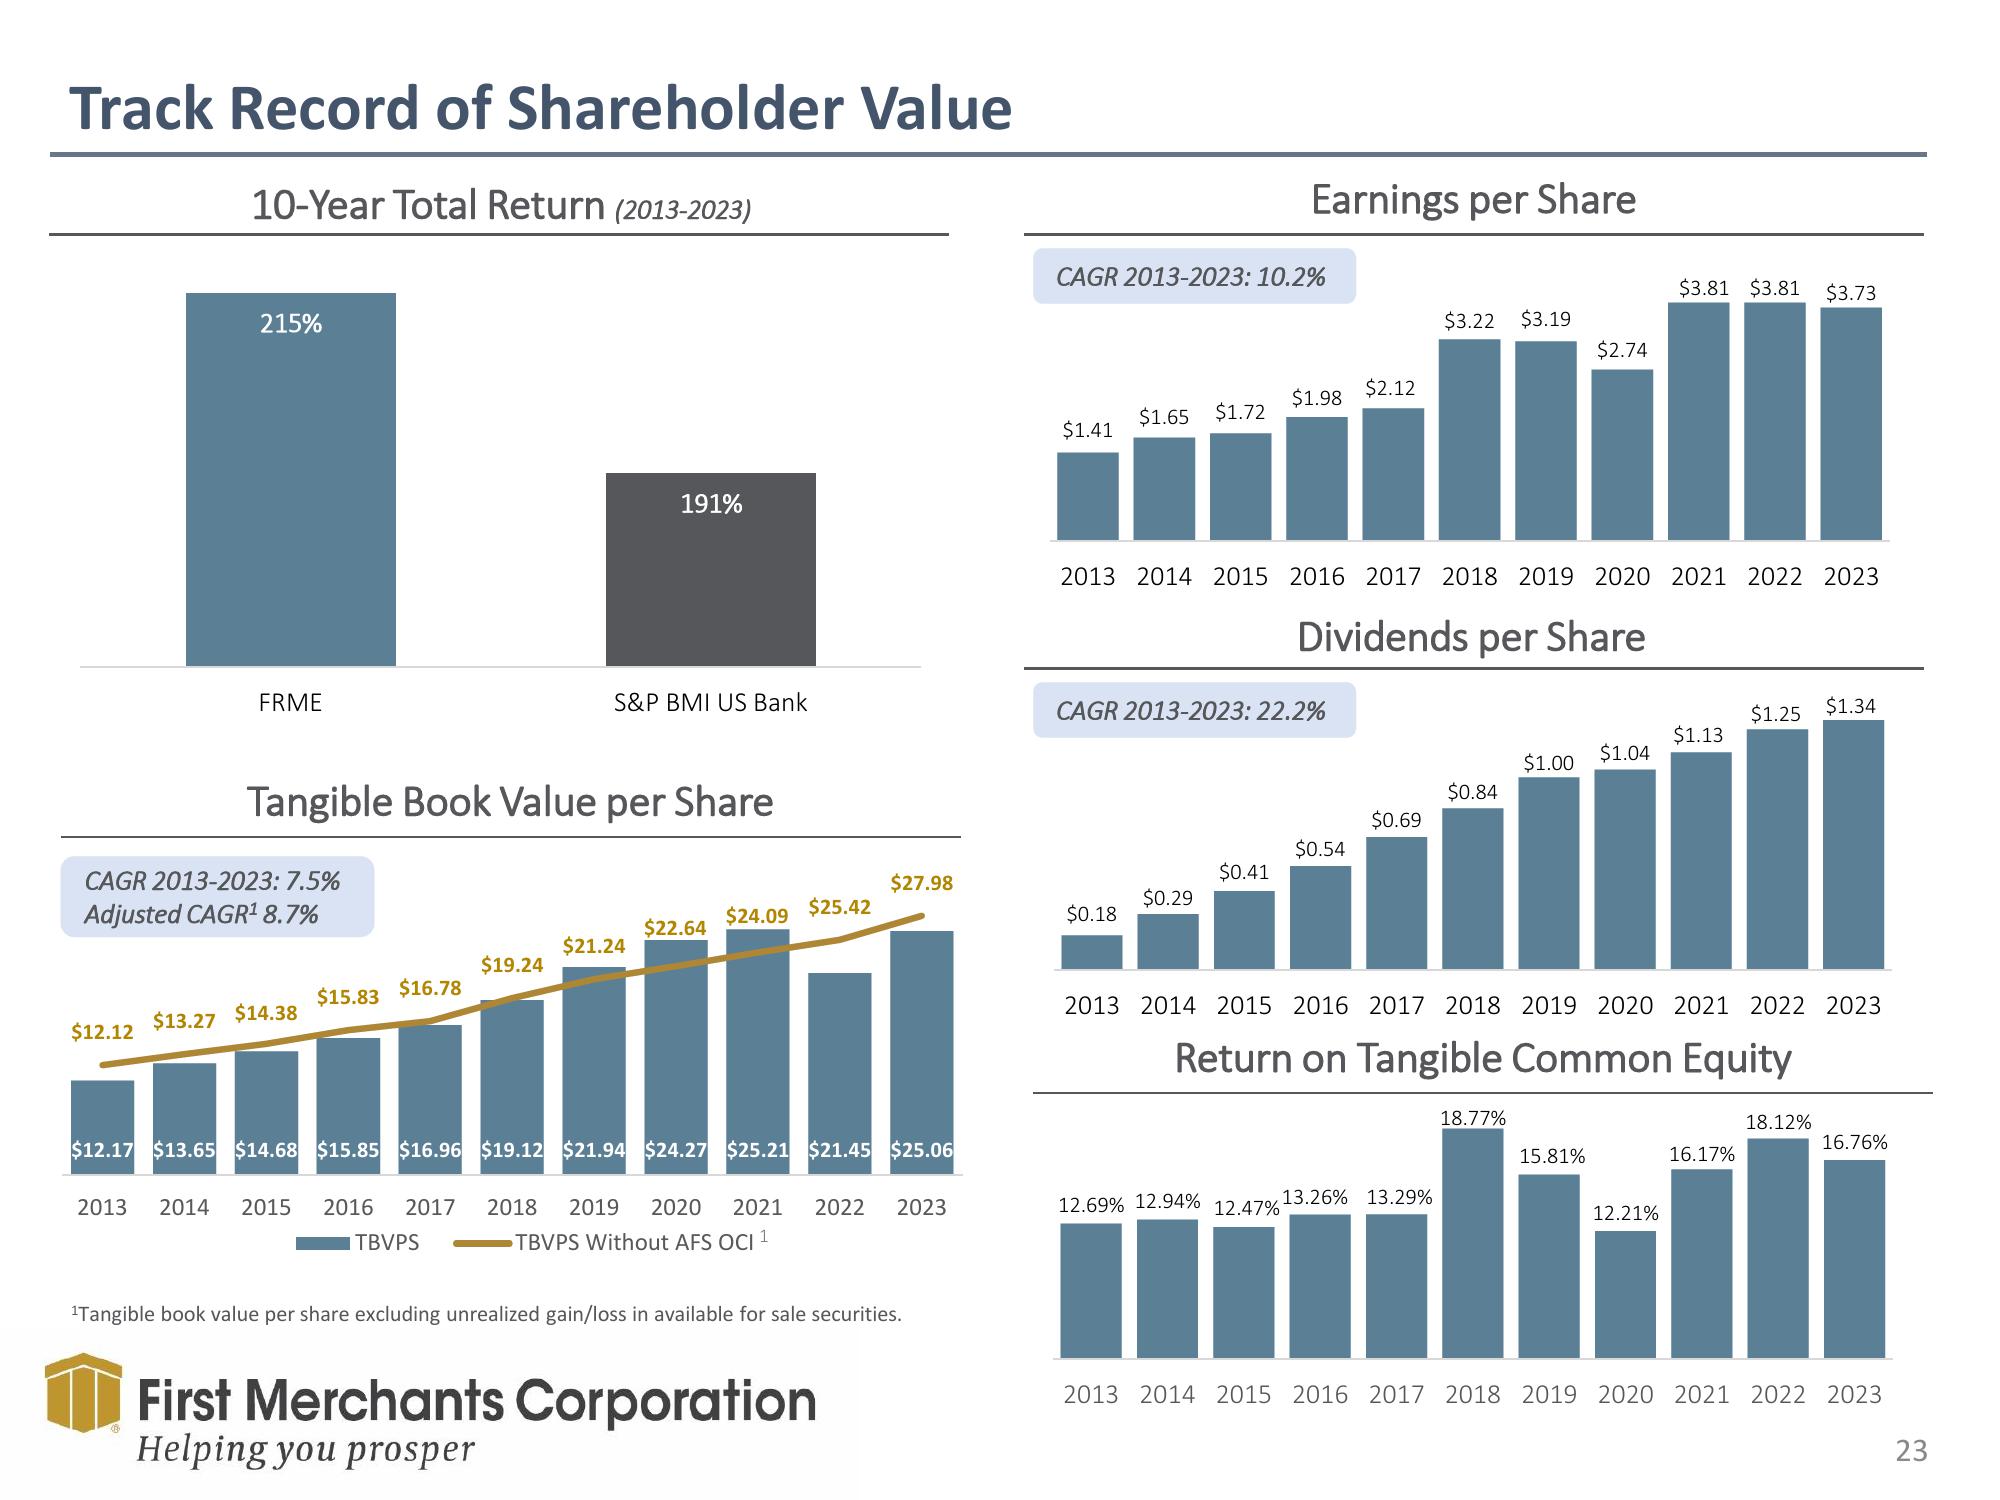
Track Record of Shareholder Value
10-Year Total Return (2013-2023)
$12.12
215%
FRME
CAGR 2013-2023: 7.5%
Adjusted CAGR¹ 8.7%
2013
Tangible Book Value per Share
$13.27 $14.38
$15.83 $16.78
2014 2015
$19.24
191%
S&P BMI US Bank
TBVPS
$21.24
$22.64
$12.17 $13.65 $14.68 $15.85 $16.96 $19.12 $21.94 $24.27 $25.21 $21.45 $25.06
$27.98
$25.42
$24.09
2016 2017 2018 2019 2020 2021 2022 2023
TBVPS Without AFS OCI ¹
¹Tangible book value per share excluding unrealized gain/loss in available for sale securities.
First Merchants Corporation
Helping you prosper
CAGR 2013-2023: 10.2%
$1.41
$1.65 $1.72
$0.18
Earnings per Share
CAGR 2013-2023: 22.2%
$0.29
$0.41
$1.98
2013 2014 2015 2016 2017 2018 2019 2020 2021 2022 2023
Dividends per Share
12.69% 12.94% 12.47%
$2.12
$0.54
$0.69
$3.22 $3.19
13.26% 13.29%
||
$0.84
$1.00
18.77%
$2.74
2013 2014 2015 2016 2017 2018 2019 2020 2021 2022 2023
Return on Tangible Common Equity
15.81%
$1.04
$3.81 $3.81 $3.73
12.21%
$1.13
$1.25 $1.34
16.17%
18.12%
16.76%
2013 2014 2015 2016 2017 2018 2019 2020 2021 2022 2023
23View entire presentation