HSBC Results Presentation Deck
Adjusted costs
Operating expenses trend, $m
9,092
802
1,424
6,866
4Q20
7,486
3Q21
8,043
1,547
6,496
(167)
1Q21
7,836
1,441
4021 vs. 3021 (excl. levy), $m
6,395
UK bank levy Technology22
76
2021
10%
159
Cost Marketing, PRP
T&E
saves
7,486
1,429
6,057
3Q21
Other Group costs
158
Tech
spend 38
513
8,341
1,544
116
6,681
4Q21
8,225
4Q21
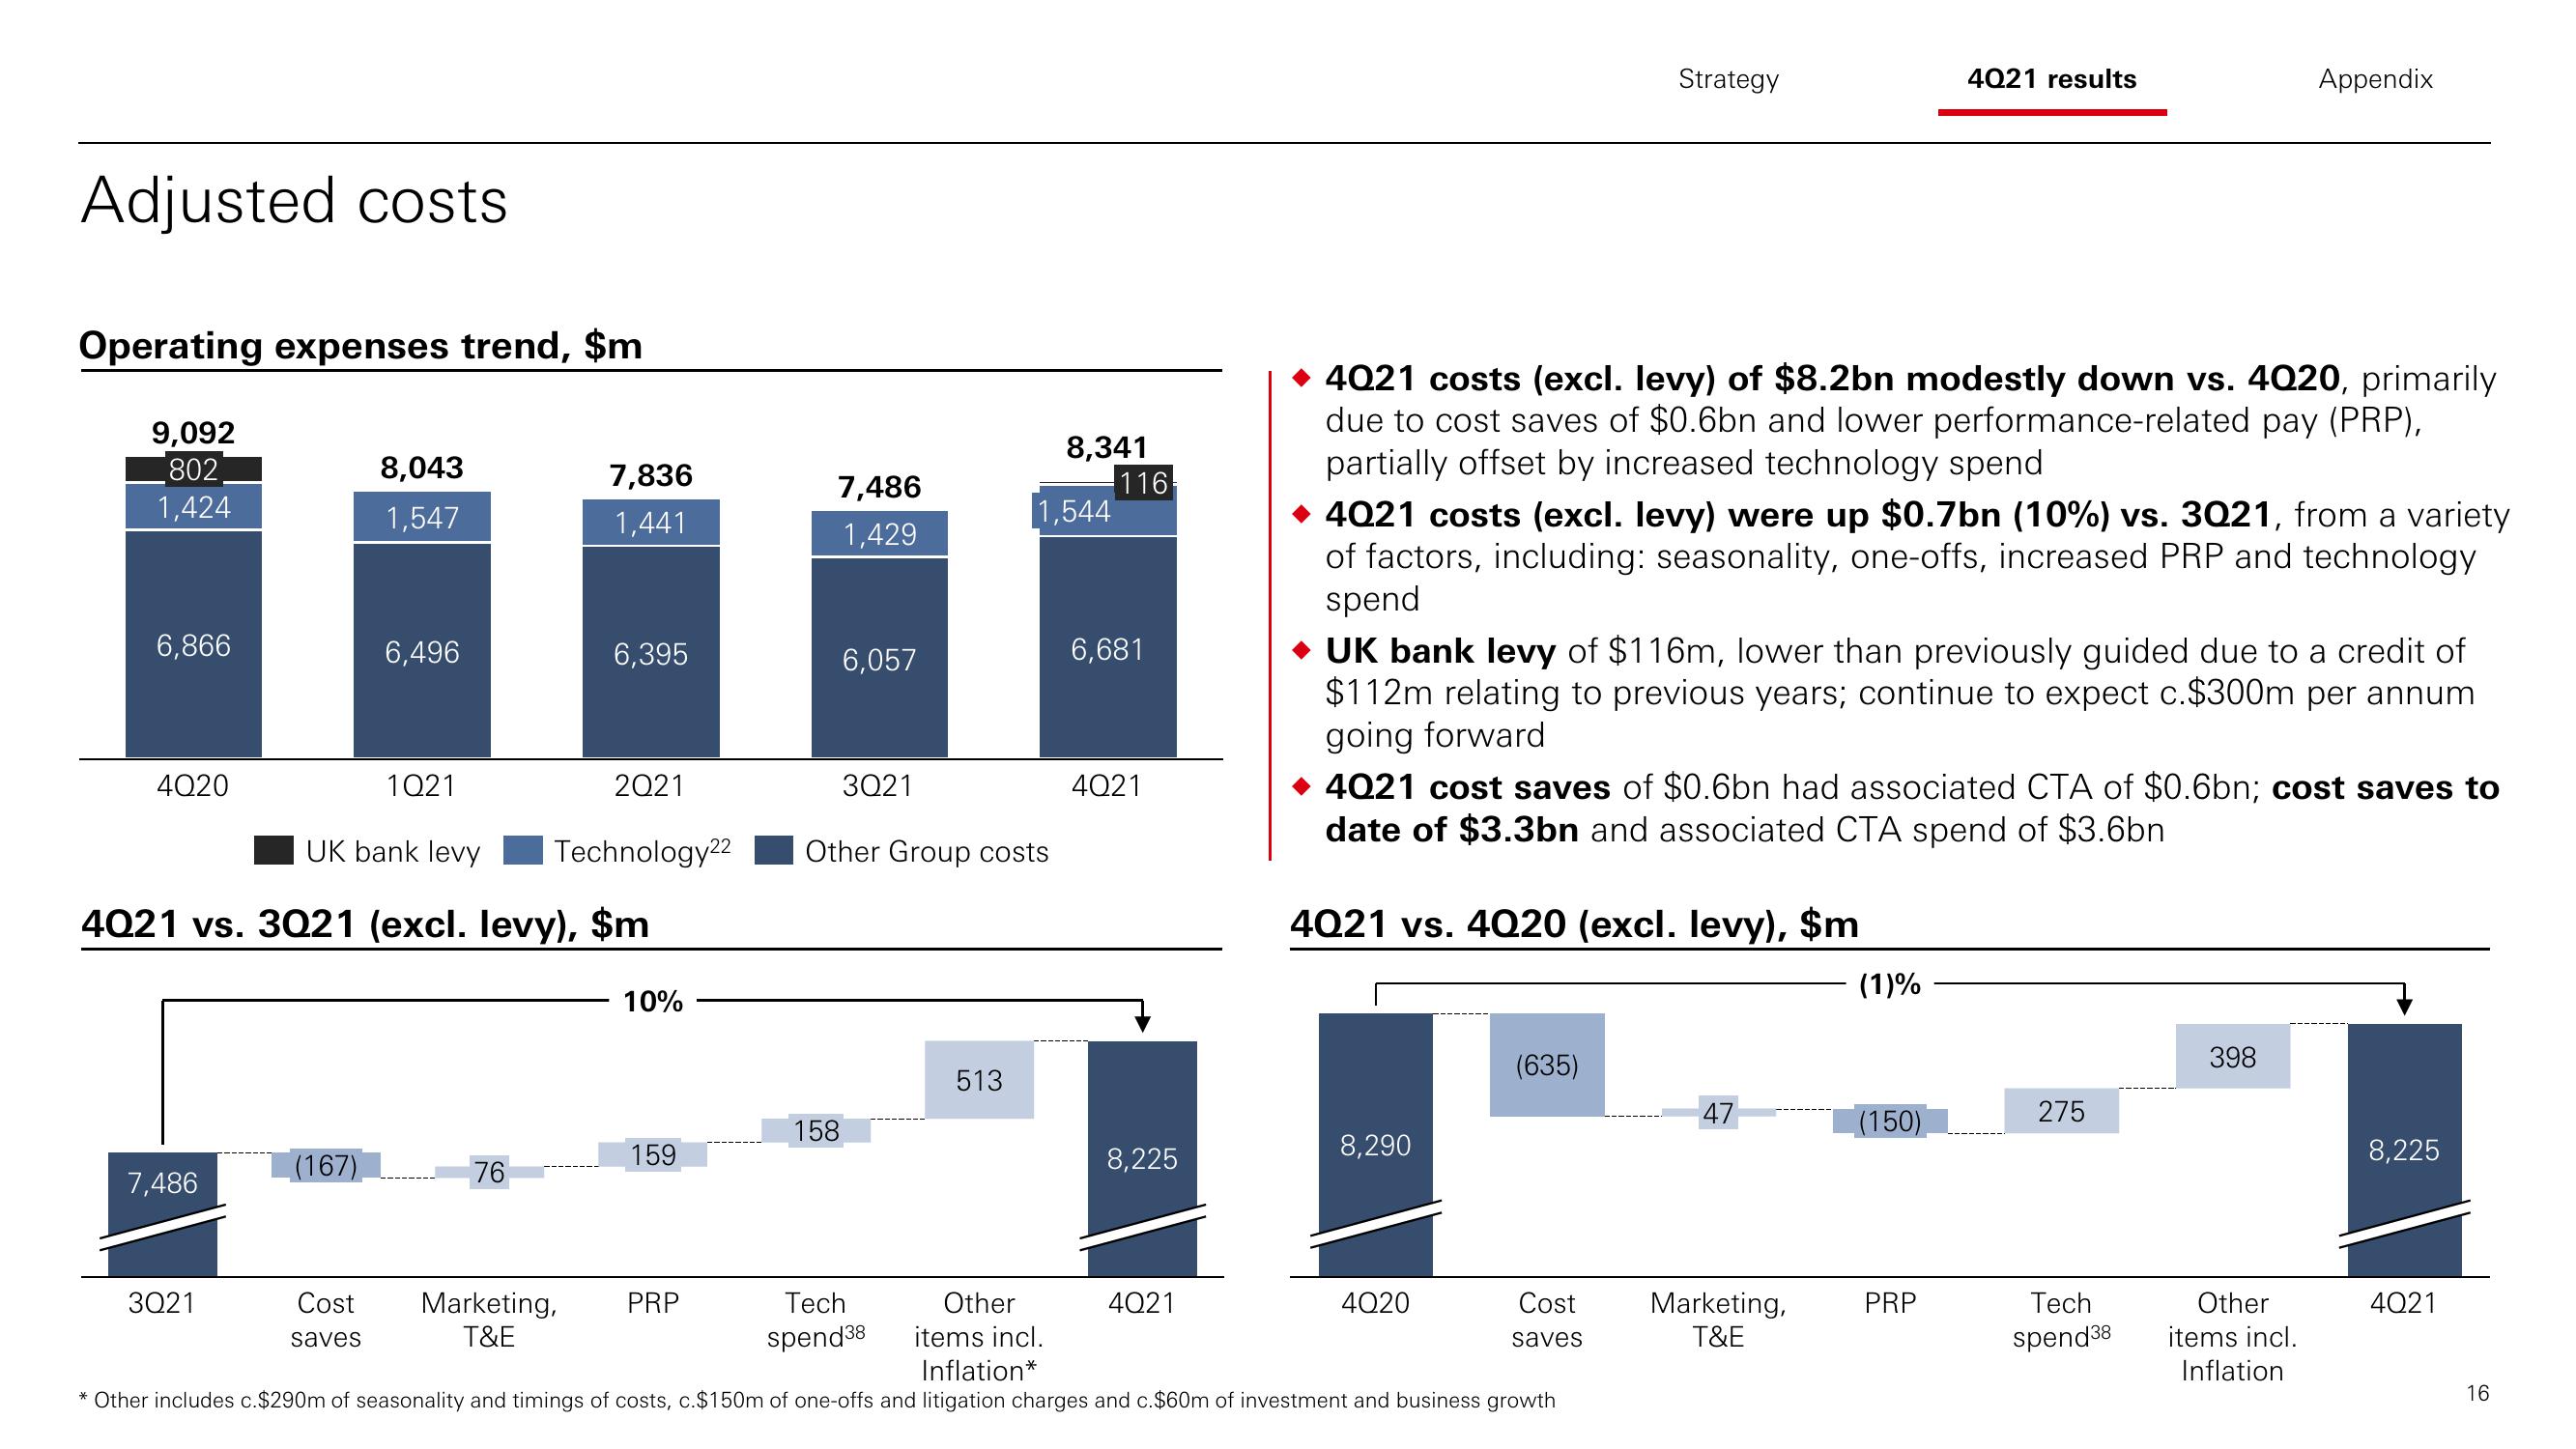
4021 costs (excl. levy) of $8.2bn modestly down vs. 4020, primarily
due to cost saves of $0.6bn and lower performance-related pay (PRP),
partially offset by increased technology spend
4021 costs (excl. levy) were up $0.7bn (10%) vs. 3Q21, from a variety
of factors, including: seasonality, one-offs, increased PRP and technology
spend
8,290
Strategy
UK bank levy of $116m, lower than previously guided due to a credit of
$112m relating to previous years; continue to expect c.$300m per annum
going forward
4Q20
4021 cost saves of $0.6bn had associated CTA of $0.6bn; cost saves to
date of $3.3bn and associated CTA spend of $3.6bn
4021 vs. 4Q20 (excl. levy), $m
(635)
Cost
saves
Other
items incl.
Inflation*
* Other includes c.$290m of seasonality and timings of costs, c.$150m of one-offs and litigation charges and c.$60m of investment and business growth
47
4021 results
Marketing,
T&E
(1)%
(150)
PRP
Appendix
275
Tech
spend 38
398
Other
items incl.
Inflation
8,225
4Q21
16View entire presentation