MoneyLion Investor Day Presentation Deck
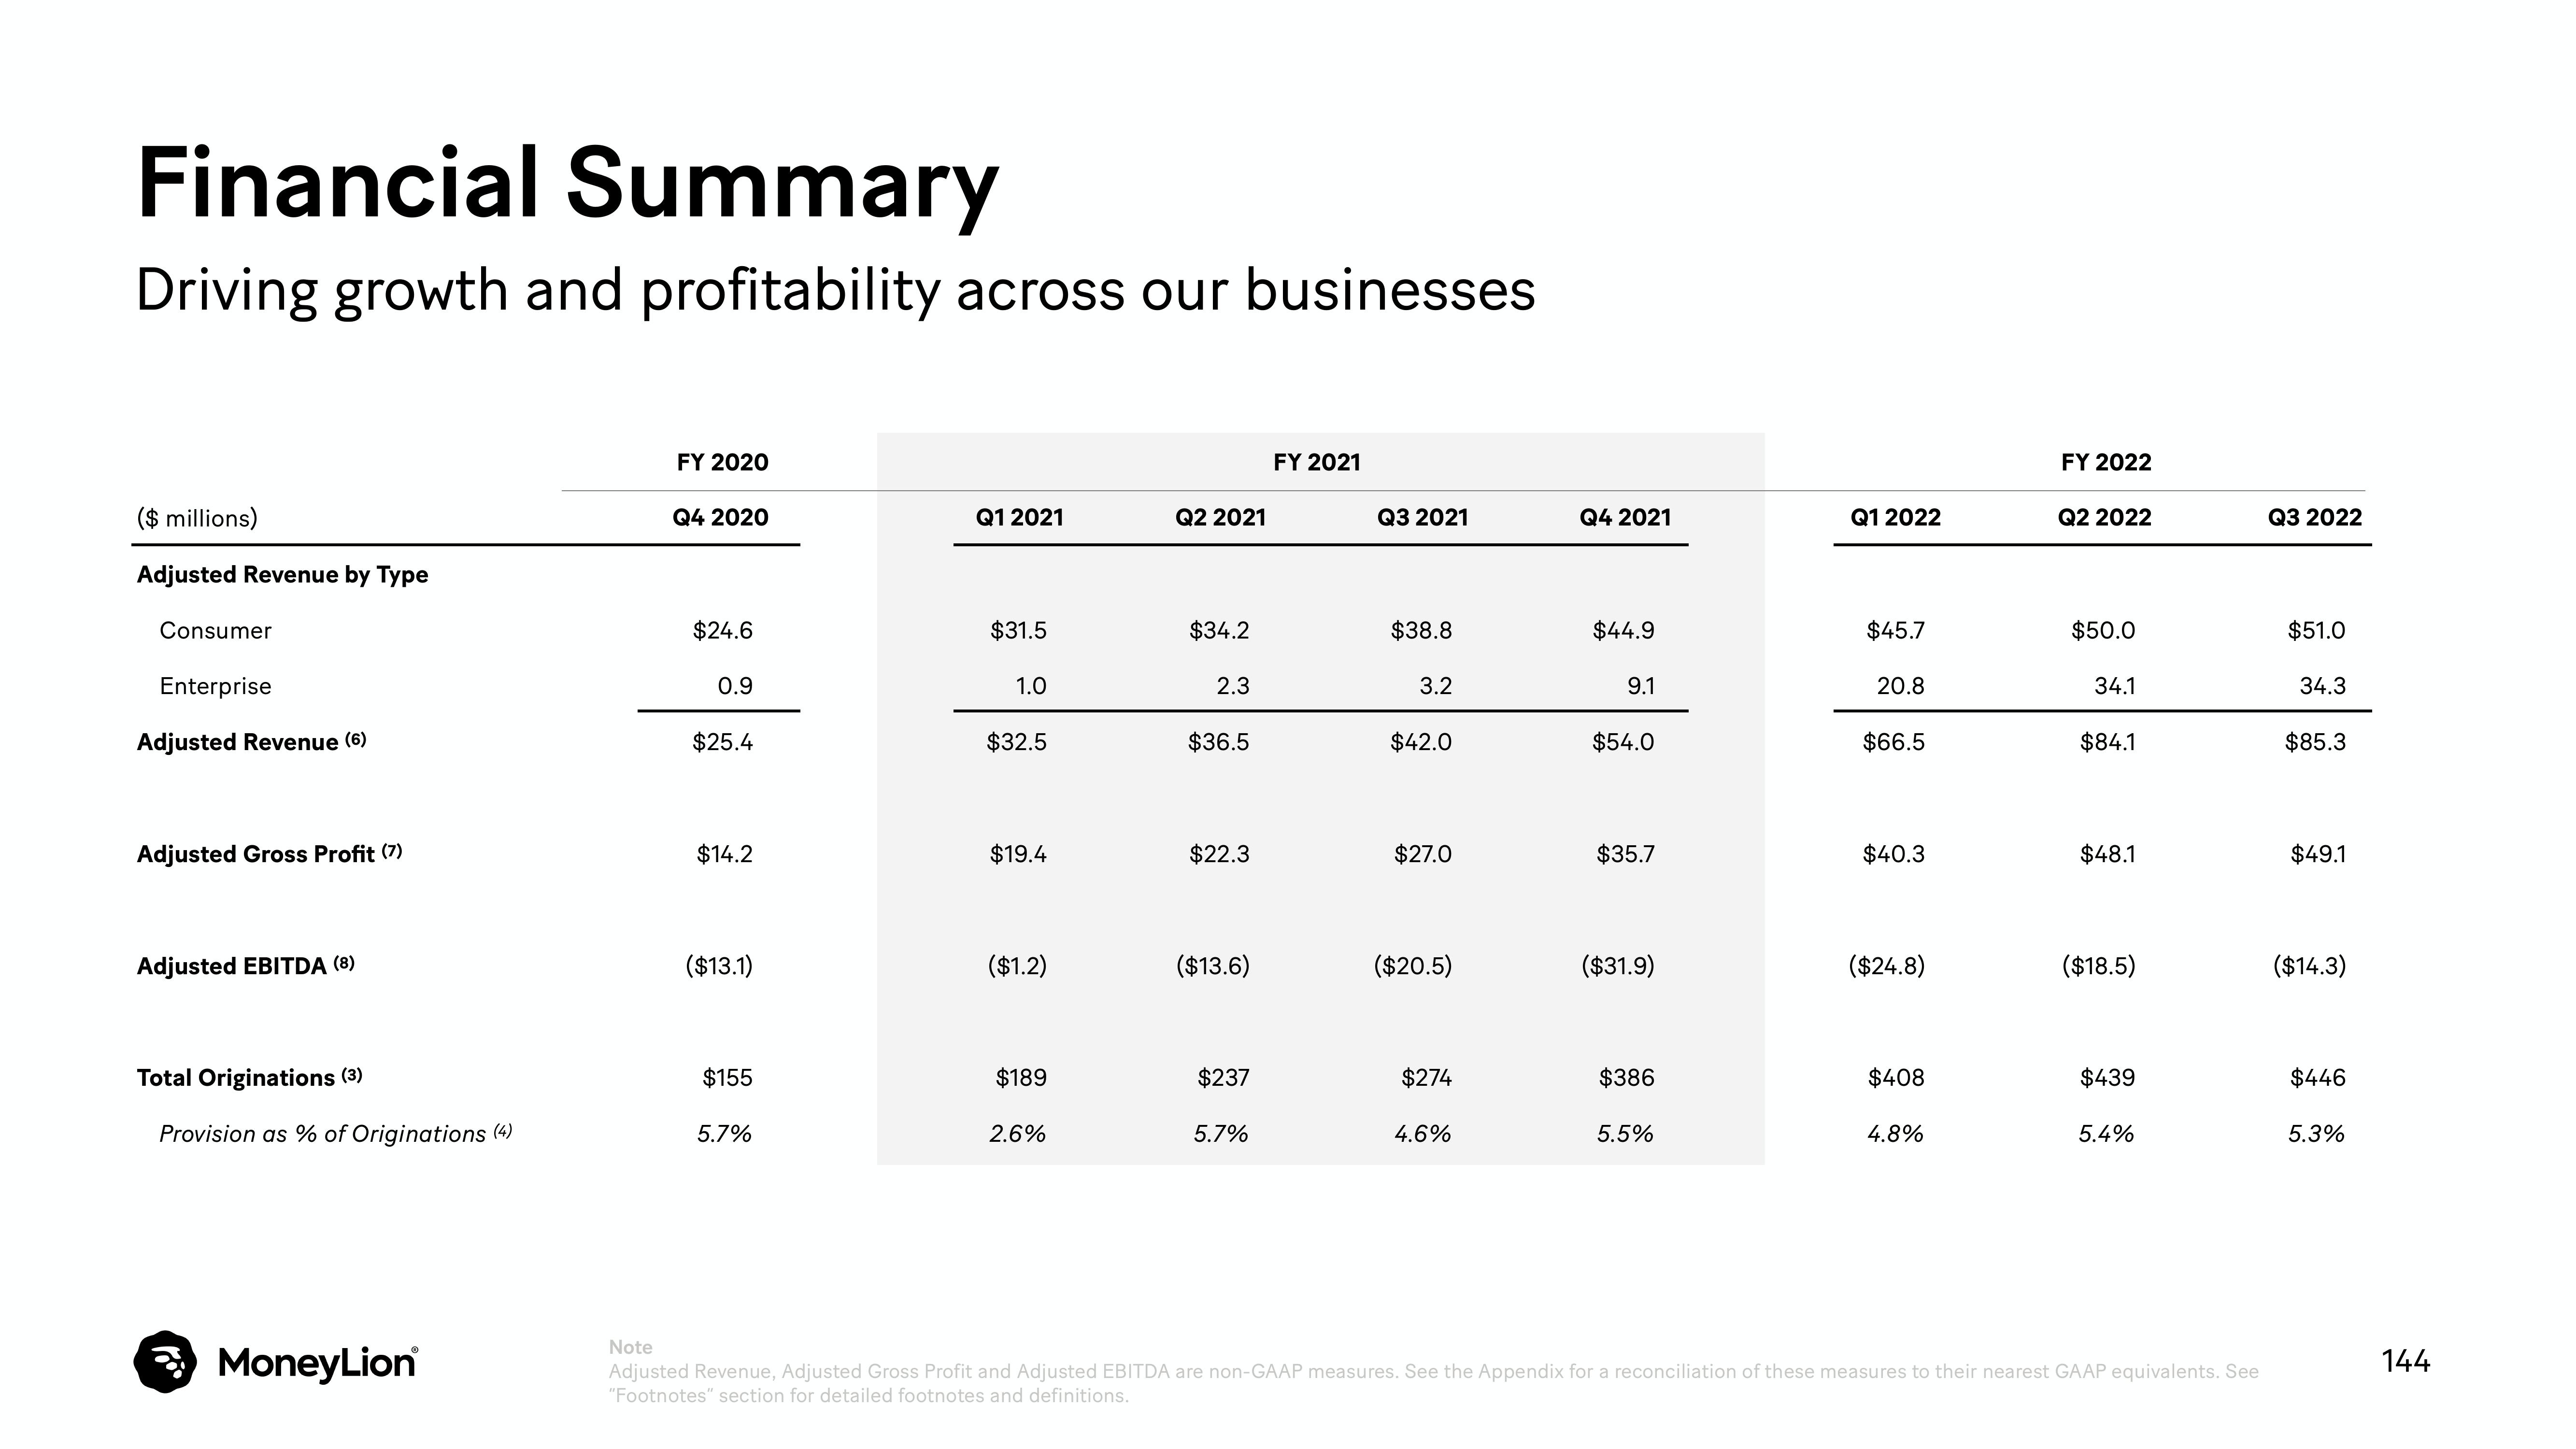
Financial Summary
Driving growth and profitability across our businesses
($ millions)
Adjusted Revenue by Type
Consumer
Enterprise
Adjusted Revenue (6)
Adjusted Gross Profit (7)
Adjusted EBITDA (8)
Total Originations (3)
Provision as % of Originations (4)
MoneyLion
FY 2020
Q4 2020
$24.6
0.9
$25.4
$14.2
($13.1)
$155
5.7%
Q1 2021
$31.5
1.0
$32.5
$19.4
($1.2)
$189
2.6%
Q2 2021
$34.2
2.3
$36.5
$22.3
($13.6)
$237
5.7%
FY 2021
Q3 2021
$38.8
3.2
$42.0
$27.0
($20.5)
$274
4.6%
Q4 2021
$44.9
9.1
$54.0
$35.7
($31.9)
$386
5.5%
Q1 2022
$45.7
20.8
$66.5
$40.3
($24.8)
$408
4.8%
FY 2022
Q2 2022
$50.0
34.1
$84.1
$48.1
($18.5)
$439
5.4%
Note
Adjusted Revenue, Adjusted Gross Profit and Adjusted EBITDA are non-GAAP measures. See the Appendix for a reconciliation of these measures to their nearest GAAP equivalents. See
"Footnotes" section for detailed footnotes and definitions.
Q3 2022
$51.0
34.3
$85.3
$49.1
($14.3)
$446
5.3%
144View entire presentation