Bird Investor Presentation Deck
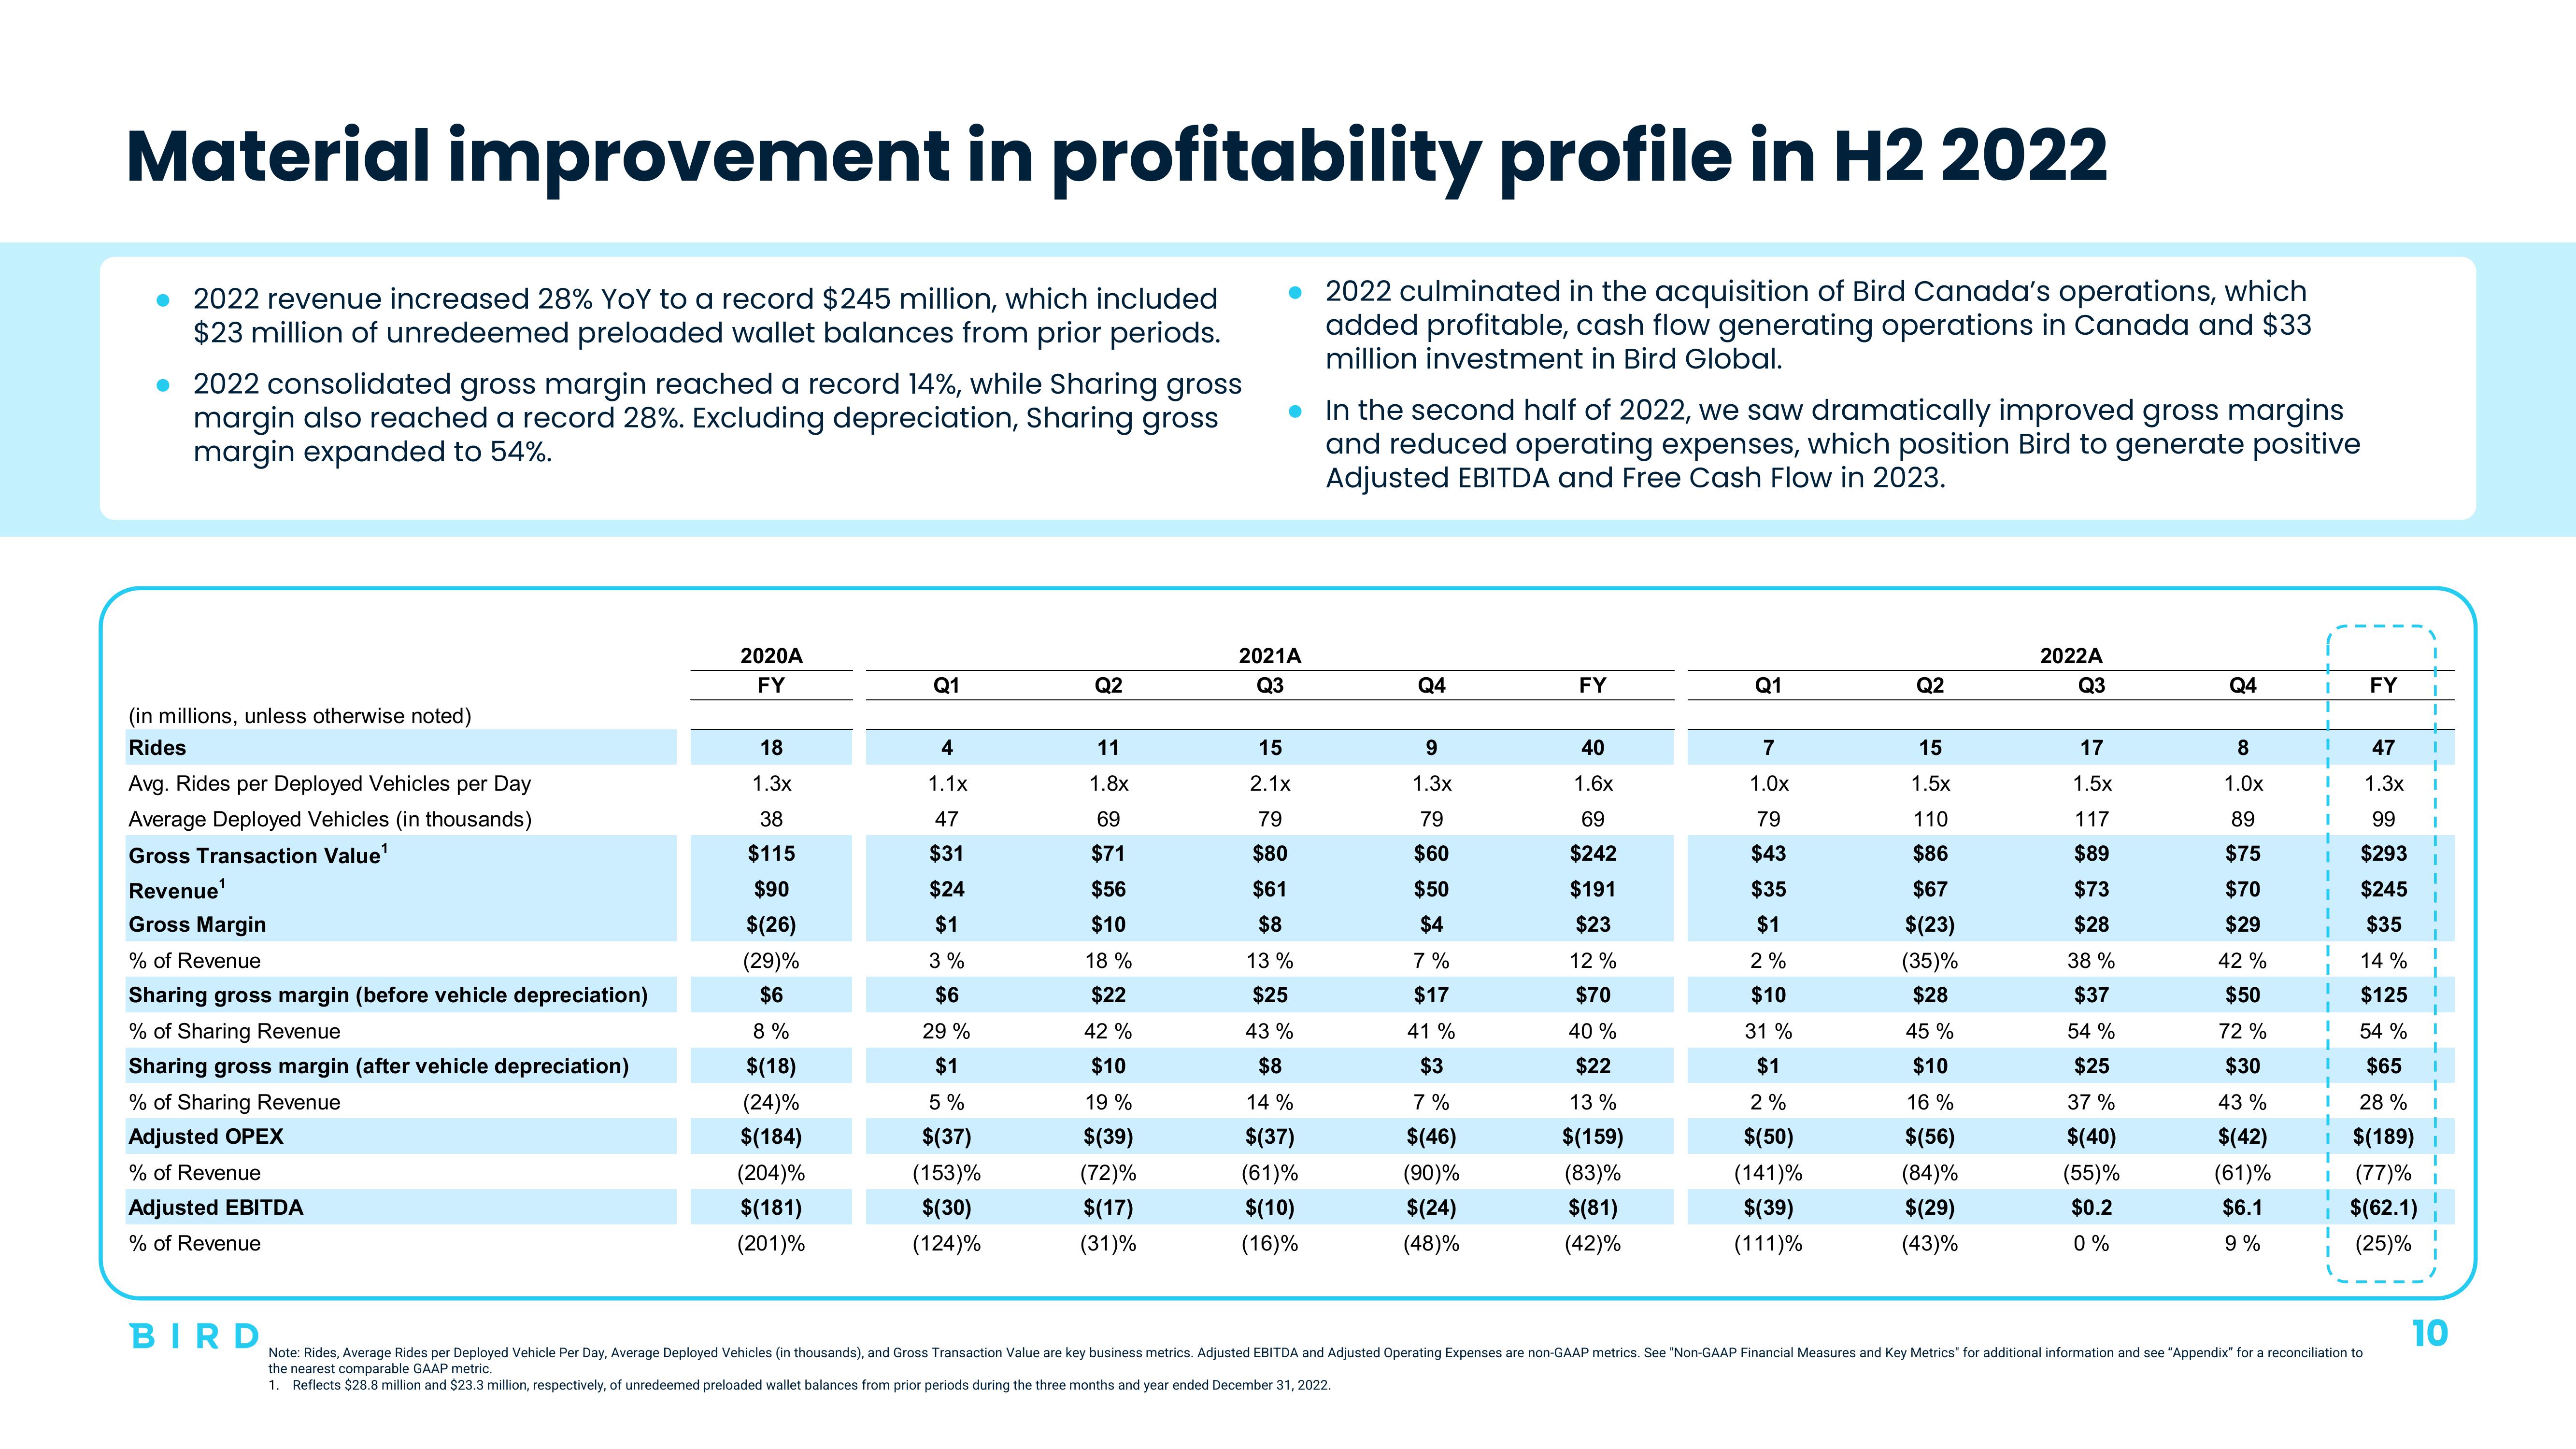
Material improvement in profitability profile in H2 2022
• 2022 revenue increased 28% YoY to a record $245 million, which included
$23 million of unredeemed preloaded wallet balances from prior periods.
• 2022 consolidated gross margin reached a record 14%, while Sharing gross
margin also reached a record 28%. Excluding depreciation, Sharing gross
margin expanded to 54%.
(in millions, unless otherwise noted)
Rides
Avg. Rides per Deployed Vehicles per Day
Average Deployed Vehicles (in thousands)
Gross Transaction Value¹
Revenue¹
Gross Margin
% of Revenue
Sharing gross margin (before vehicle depreciation)
% of Sharing Revenue
Sharing gross margin (after vehicle depreciation)
% of Sharing Revenue
Adjusted OPEX
% of Revenue
Adjusted EBITDA
% of Revenue
BIRD
2020A
FY
18
1.3x
38
$115
$90
$(26)
(29)%
$6
8%
$(18)
(24)%
$(184)
(204)%
$(181)
(201)%
Q1
4
1.1x
47
$31
$24
$1
3%
$6
29%
$1
5%
$(37)
(153)%
$(30)
(124)%
Q2
11
1.8x
69
$71
$56
$10
18 %
$22
42%
$10
19 %
$(39)
(72)%
$(17)
(31)%
• 2022 culminated in the acquisition of Bird Canada's operations, which
added profitable, cash flow generating operations in Canada and $33
million investment in Bird Global.
. In the second half of 2022, we saw dramatically improved gross margins
and reduced operating expenses, which position Bird to generate positive
Adjusted EBITDA and Free Cash Flow in 2023.
2021A
Q3
15
2.1x
79
$80
$61
$8
13%
$25
43%
$8
14%
$(37)
(61)%
$(10)
(16)%
Q4
9
1.3x
79
$60
$50
$4
7%
$17
41%
$3
7%
$(46)
(90)%
$(24)
(48)%
FY
40
1.6x
69
$242
$191
$23
12%
$70
40%
$22
13 %
$(159)
(83)%
$(81)
(42)%
Q1
7
1.0x
79
$43
$35
$1
2%
$10
31%
$1
2%
$(50)
(141)%
$(39)
(111)%
Q2
15
1.5x
110
$86
$67
$(23)
(35)%
$28
45 %
$10
16 %
$(56)
(84)%
$(29)
(43)%
2022A
Q3
17
1.5x
117
$89
$73
$28
38 %
$37
54%
$25
37%
$(40)
(55)%
$0.2
0%
Q4
8
1.0x
89
$75
$70
$29
42%
$50
72%
$30
43 %
$(42)
(61)%
$6.1
9%
1
1
FY
47
1.3x
99
$293
$245
$35
14%
$125
54%
$65
28%
$(189)
(77)%
$(62.1)
(25)%
Note: Rides, Average Rides per Deployed Vehicle Per Day, Average Deployed Vehicles (in thousands), and Gross Transaction Value are key business metrics. Adjusted EBITDA and Adjusted Operating Expenses are non-GAAP metrics. See "Non-GAAP Financial Measures and Key Metrics" for additional information and see "Appendix" for a reconciliation to
the nearest comparable GAAP metric.
1. Reflects $28.8 million and $23.3 million, respectively, of unredeemed preloaded wallet balances from prior periods during the three months and year ended December 31, 2022.
10View entire presentation