Blend Investor Day Presentation Deck
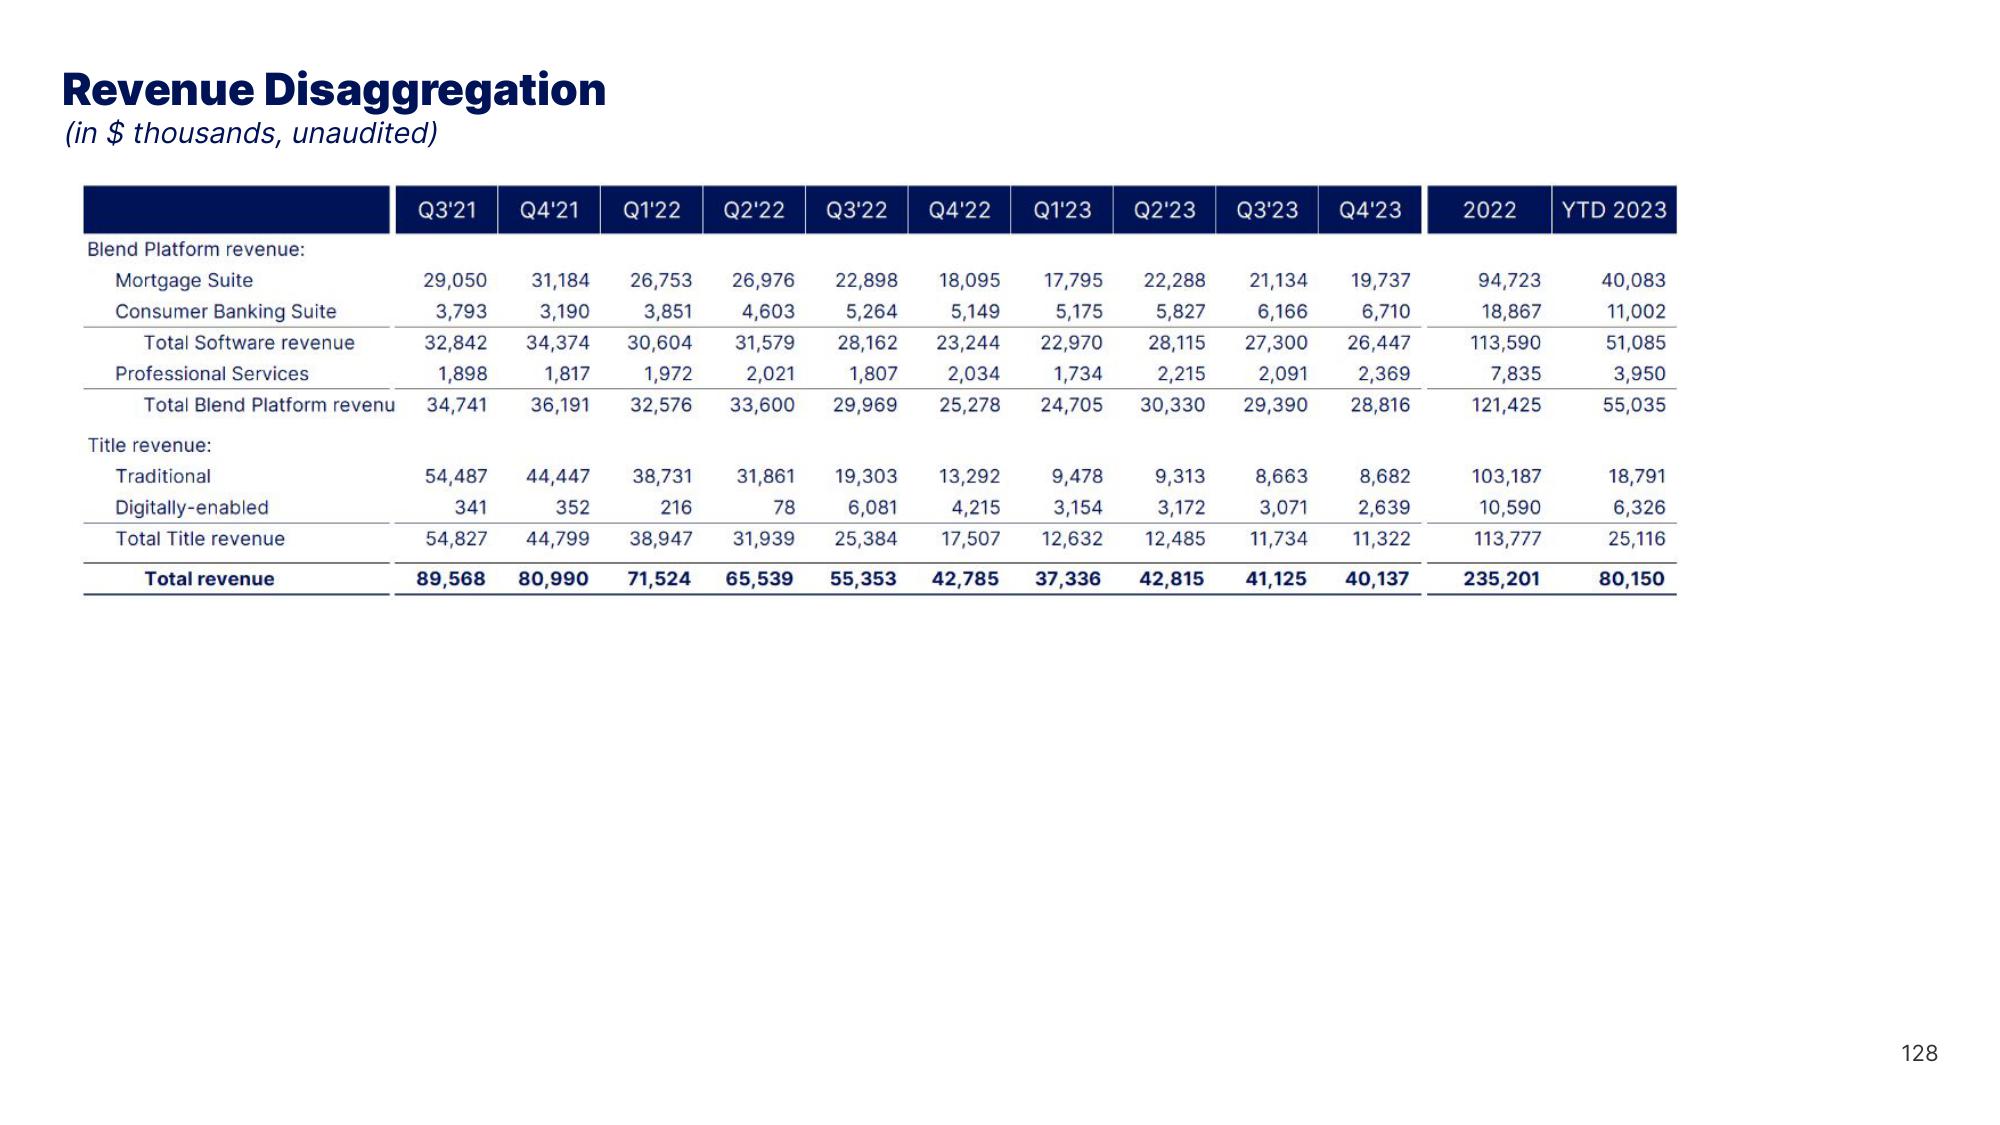
Revenue Disaggregation
(in $thousands, unaudited)
Blend Platform revenue:
Mortgage Suite
Consumer Banking Suite
Total Software revenue
Professional Services
Total Blend Platform revenu
Title revenue:
Traditional
Digitally-enabled
Total Title revenue
Total revenue
Q3'21 Q4'21 Q1'22 Q2'22
Q3'22 Q4'22
54,487
341
44,447
352
38,731 31,861
216
78
38,947 31,939
89,568 80,990 71,524 65,539
54,827 44,799
Q1'23 Q2'23 Q3'23 Q4'23
29,050 31,184 26,753 26,976 22,898 18,095
17,795 22,288 21,134 19,737
3,793 3,190 3,851 4,603 5,264 5,149 5,175 5,827 6,166 6,710
32,842 34,374 30,604 31,579
28,162
23,244 22,970 28,115 27,300 26,447
1,898 1,817 1,972 2,021 1,807 2,034 1,734 2,215 2,091 2,369
34,741 36,191 32,576 33,600 29,969 25,278 24,705 30,330 29,390 28,816
19,303 13,292 9,478 9,313 8,663 8,682
6,081 4,215 3,154 3,172 3,071 2,639
25,384 17,507 12,632 12,485 11,734 11,322
55,353 42,785 37,336 42,815 41,125 40,137
2022
94,723
18,867
113,590
7,835
121,425
103,187
10,590
113,777
235,201
YTD 2023
40,083
11,002
51,085
3,950
55,035
18,791
6,326
25,116
80,150
128View entire presentation