Paysafe Results Presentation Deck
Strong balance sheet and liquidity
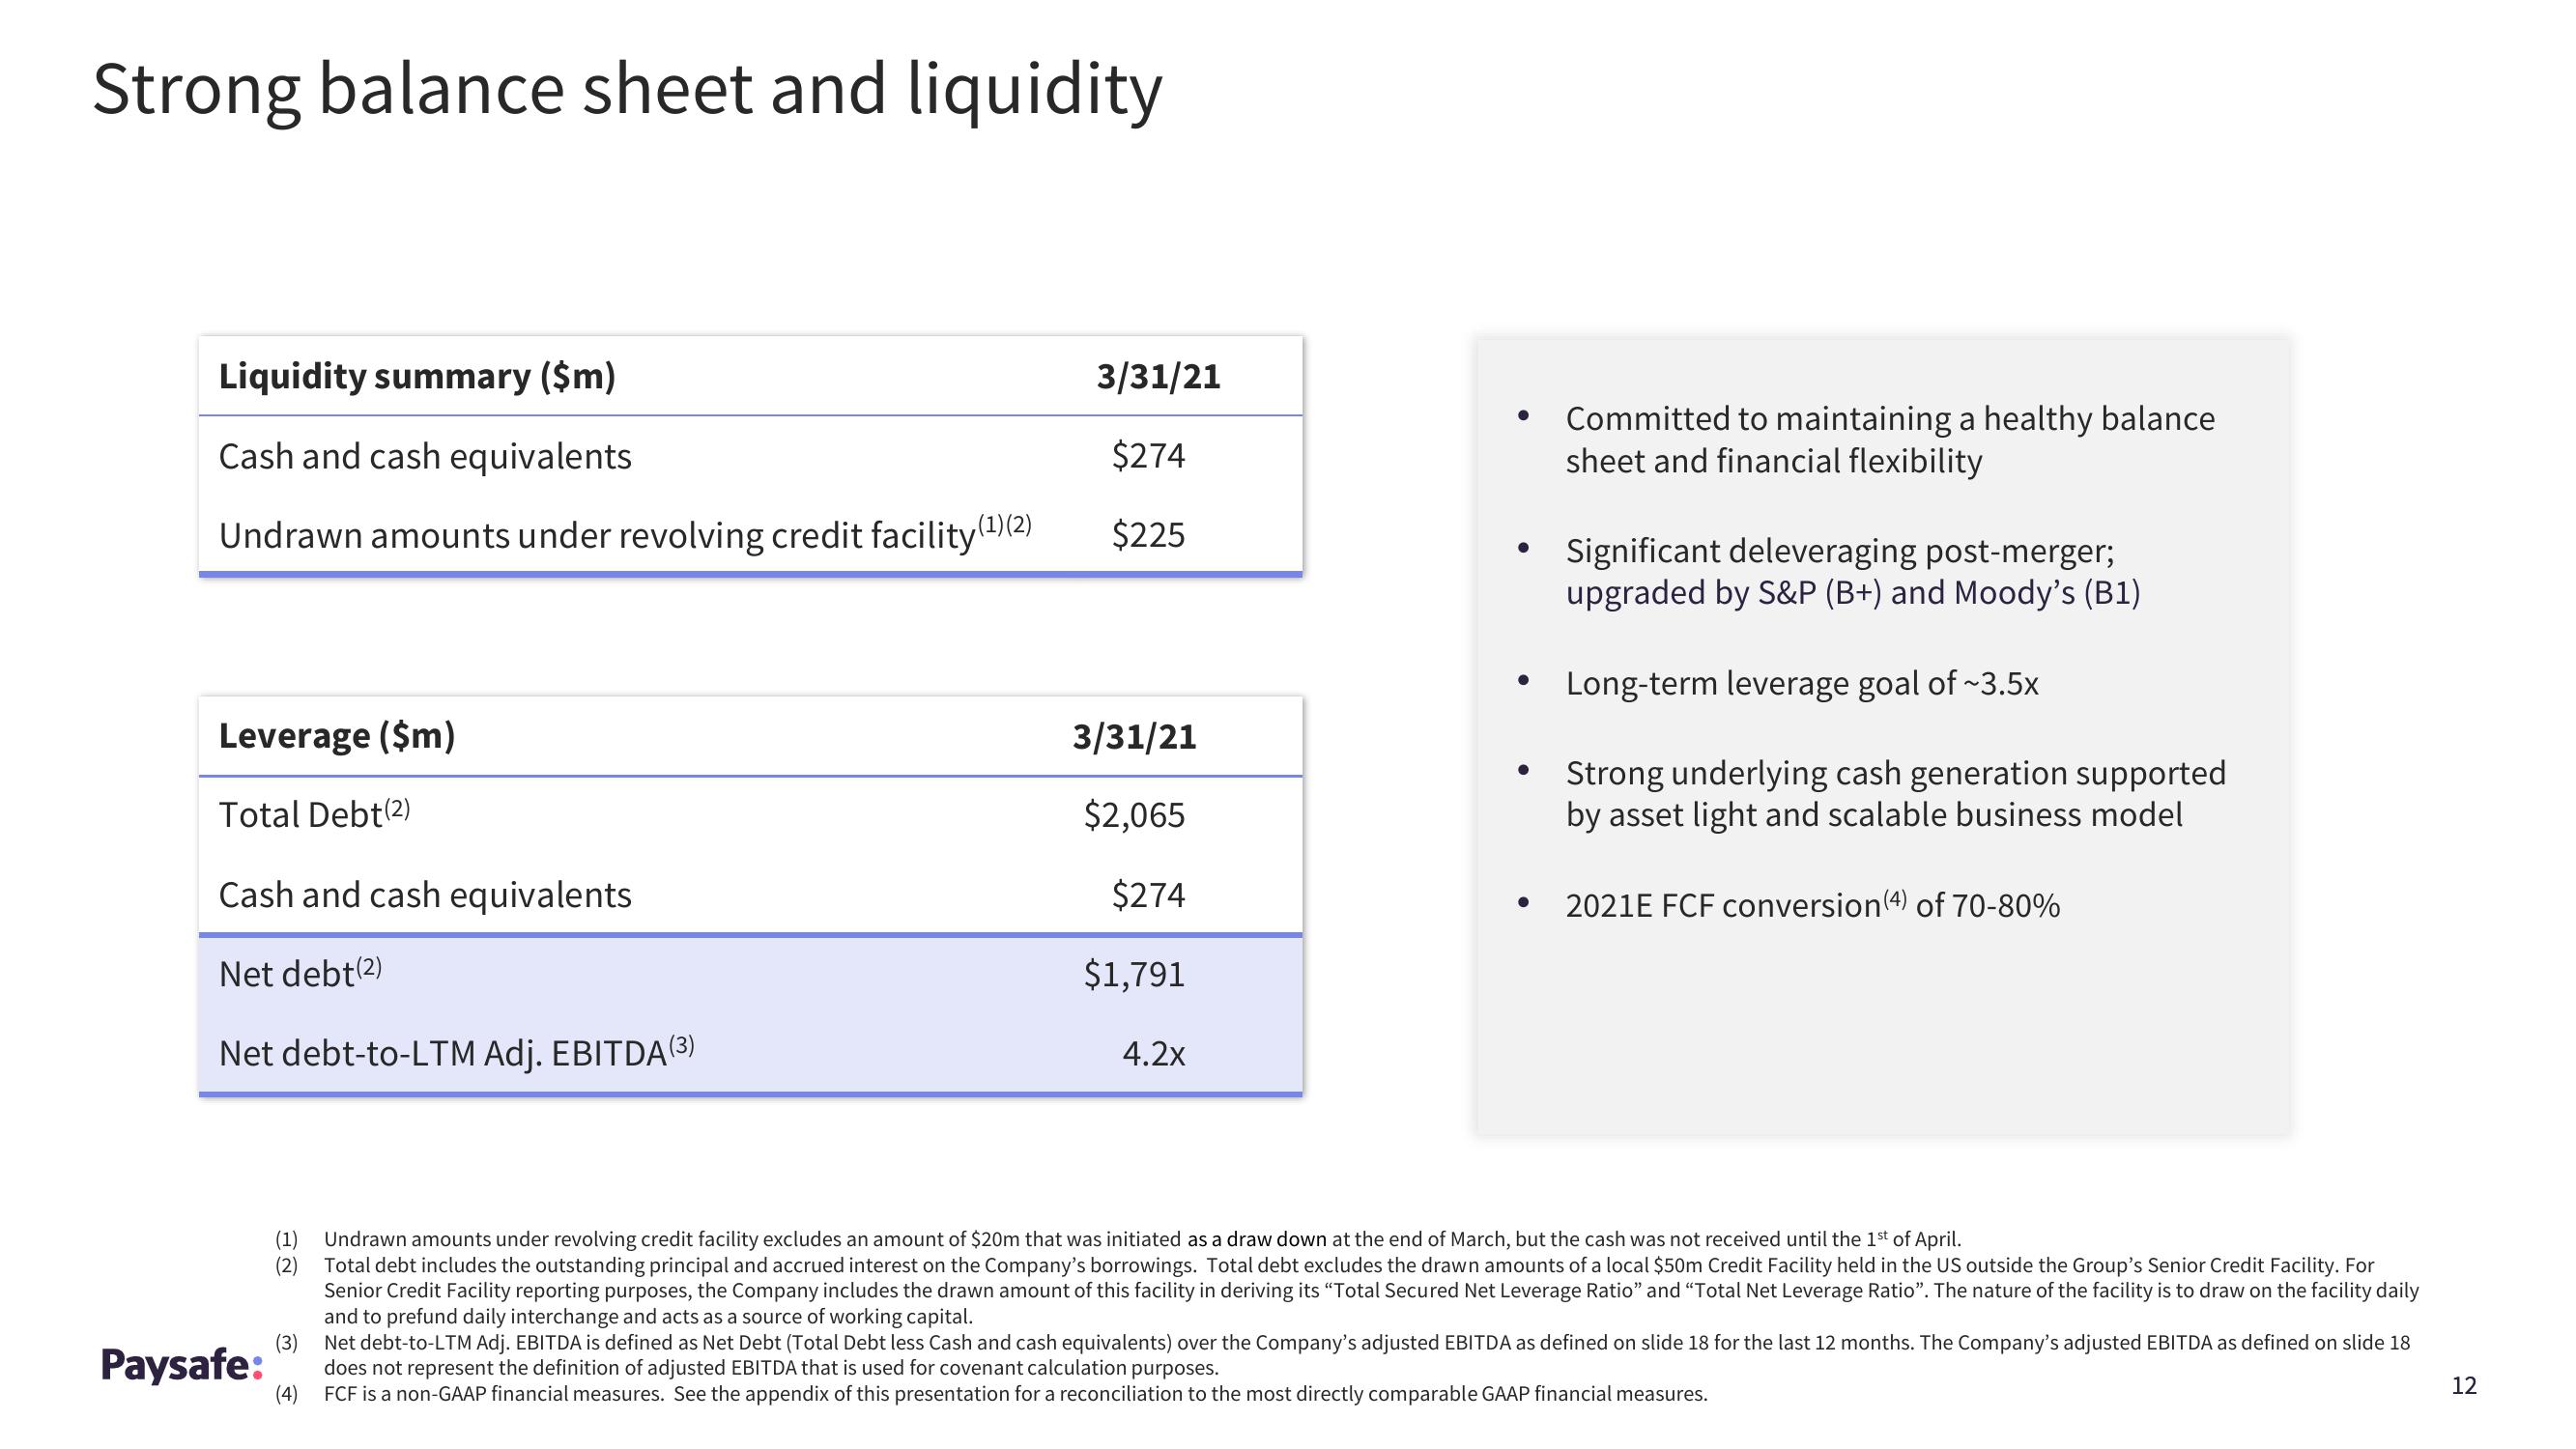
Liquidity summary ($m)
Cash and cash equivalents
Undrawn amounts under revolving credit facility (¹)(2)
Leverage ($m)
Total Debt (2)
Cash and cash equivalents
Net debt(2)
Net debt-to-LTM Adj. EBITDA (3)
Paysafe:
3/31/21
$274
$225
3/31/21
$2,065
$274
$1,791
4.2x
●
• Significant deleveraging post-merger;
upgraded by S&P (B+) and Moody's (B1)
Long-term leverage goal of ~3.5x
Strong underlying cash generation supported
by asset light and scalable business model
●
●
Committed to maintaining a healthy balance
sheet and financial flexibility
●
2021E FCF conversion (4) of 70-80%
(1) Undrawn amounts under revolving credit facility excludes an amount of $20m that was initiated as a draw down at the end of March, but the cash was not received until the 1st of April.
(2)
Total debt includes the outstanding principal and accrued interest on the Company's borrowings. Total debt excludes the drawn amounts of a local $50m Credit Facility held in the US outside the Group's Senior Credit Facility. For
Senior Credit Facility reporting purposes, the Company includes the drawn amount of this facility in deriving its "Total Secured Net Leverage Ratio" and "Total Net Leverage Ratio". The nature of the facility is to draw on the facility daily
and to prefund daily interchange and acts as a source of working capital.
(3)
Net debt-to-LTM Adj. EBITDA is defined as Net Debt (Total Debt less Cash and cash equivalents) over the Company's adjusted EBITDA as defined on slide 18 for the last 12 months. The Company's adjusted EBITDA as defined on slide 18
does not represent the definition of adjusted EBITDA that is used for covenant calculation purposes.
(4)
FCF is a non-GAAP financial measures. See the appendix of this presentation for a reconciliation to the most directly comparable GAAP financial measures.
12View entire presentation