Deutsche Bank Results Presentation Deck
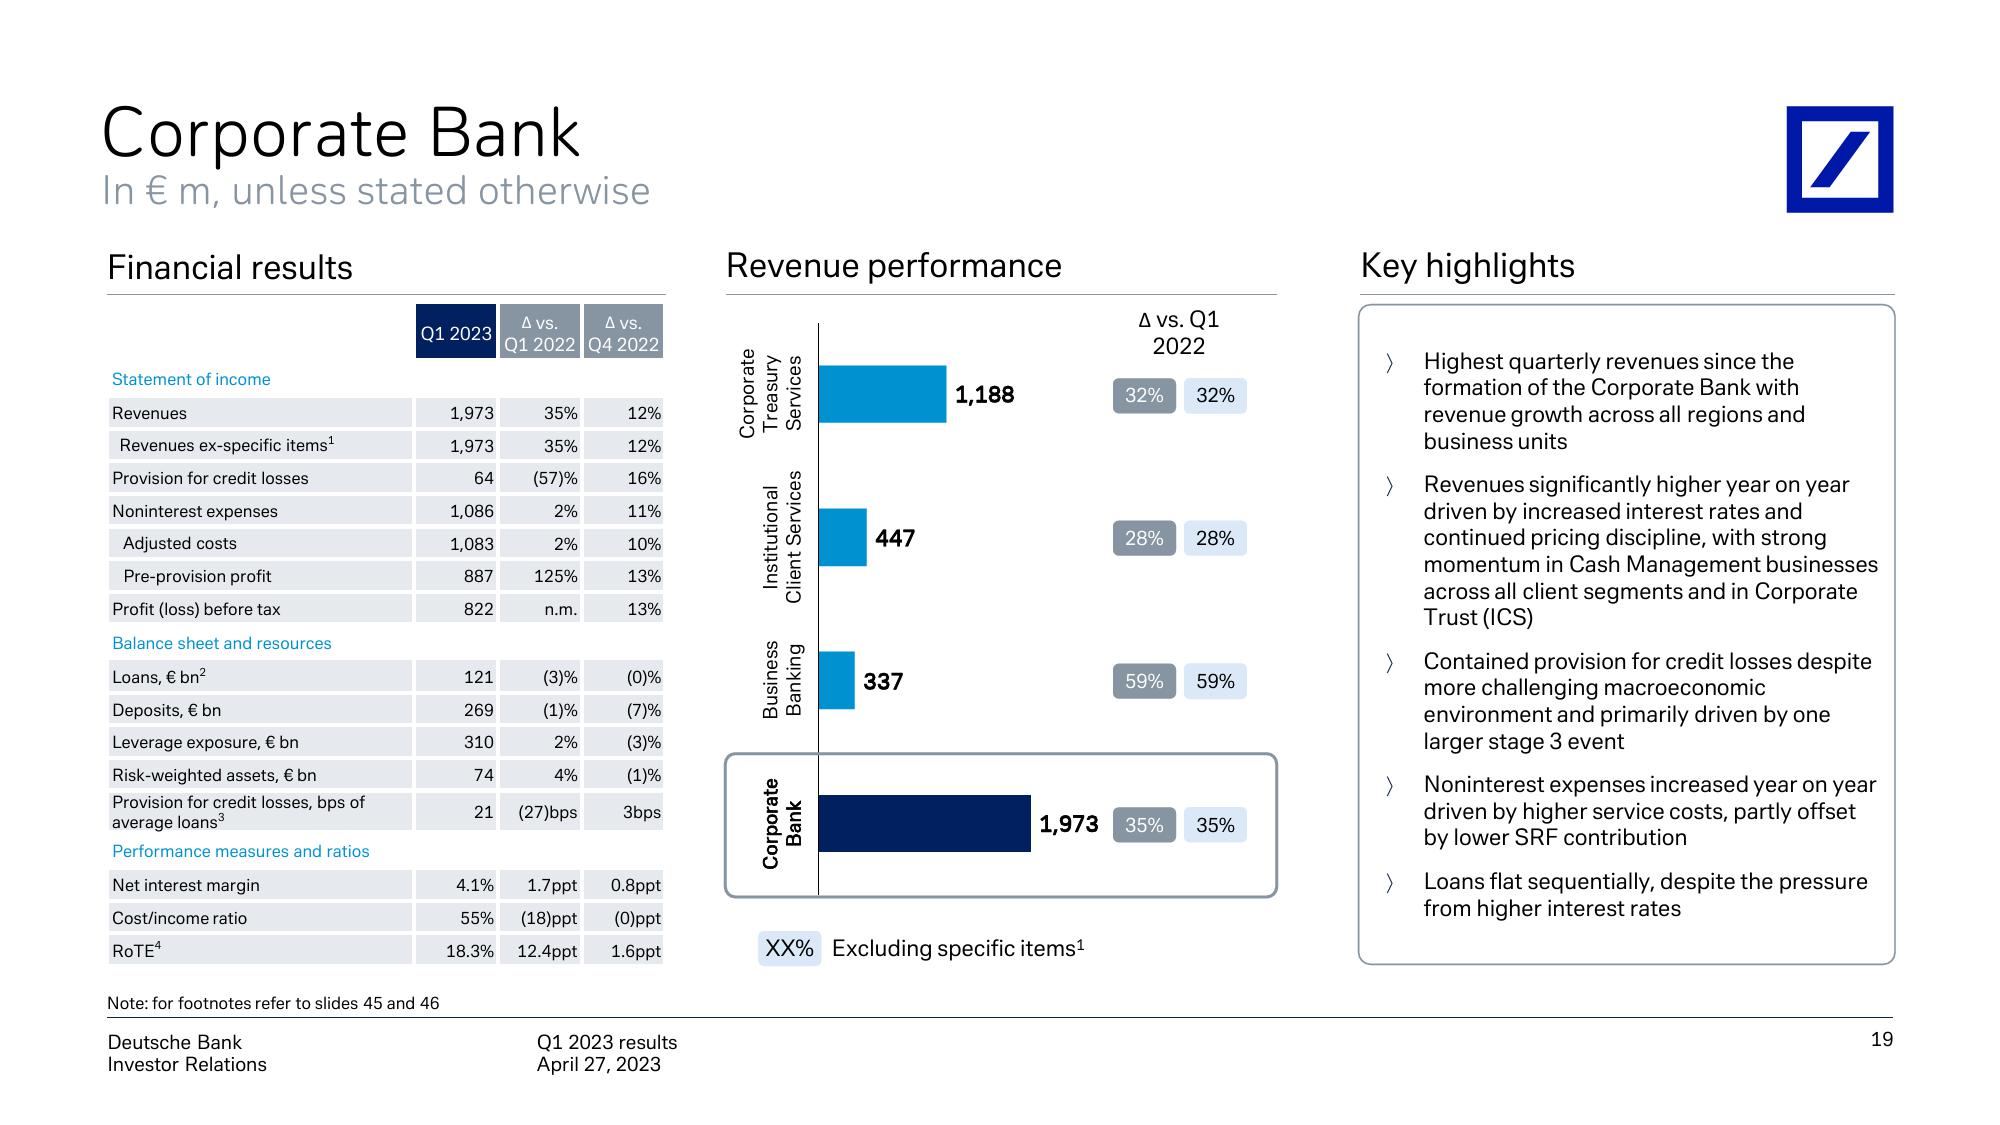
Corporate Bank
In € m, unless stated otherwise
Financial results
Statement of income.
Revenues
Revenues ex-specific items¹
Provision for credit losses
Noninterest expenses
Adjusted costs
Pre-provision profit
Profit (loss) before tax
Balance sheet and resources
Loans, € bn²
Deposits, € bn
Leverage exposure, € bn
Risk-weighted assets, € bn
Provision for credit losses, bps of
average loans³
Performance measures and ratios
Net interest margin
Cost/income ratio
ROTE4
Q1 2023
Note: for footnotes refer to slides 45 and 46
Deutsche Bank
Investor Relations
1,973
1,973
64
1,086
1,083
887
822
121
269
310
74
21
4.1%
55%
18.3%
A vs.
A vs.
Q1 2022 Q4 2022
35%
35%
(57)%
2%
2%
125%
n.m.
(3)%
(1)%
2%
(0)%
(7)%
(3)%
(1)%
(27)bps 3bps
12%
12%
16%
11%
10%
13%
13%
4%
1.7ppt 0.8ppt
(18)ppt
(0)ppt
12.4ppt 1.6ppt
Q1 2023 results
April 27, 2023
Revenue performance
Corporate
Treasury
Services
Client Services
Institutional
Business
Banking
Corporate
Bank
447
337
1,188
A vs. Q1
2022
XX% Excluding specific items¹
32% 32%
28% 28%
59% 59%
1,973 35%
35%
Key highlights
/
Highest quarterly revenues since the
formation of the Corporate Bank with
revenue growth across all regions and
business units
Revenues significantly higher year on year
driven by increased interest rates and
continued pricing discipline, with strong
momentum in Cash Management businesses
across all client segments and in Corporate
Trust (ICS)
Contained provision for credit losses despite
more challenging macroeconomic
environment and primarily driven by one
larger stage 3 event
Noninterest expenses increased year on year
driven by higher service costs, partly offset
by lower SRF contribution
Loans flat sequentially, despite the pressure
from higher interest rates
19View entire presentation