Comcast Results Presentation Deck
Sky 4th Quarter 2020 Overview
8
Customer Relationships
24.0
+2%
4Q 19
Revenue
$5,040
4Q 19
23.9
+1%
1Q20
(0.9%)
$5,205
4Q20
23.7
(1%)
2Q20
(1%)
23.7
$765
4Q 19
3Q20
All percentages represent year/year constant currency growth rates.
See Notes on Slide 13
23.9
0%
($M) Adjusted EBITDA ($M)
4Q20
(82.3%)
(M)
$139
4Q20
Commentary
●
●
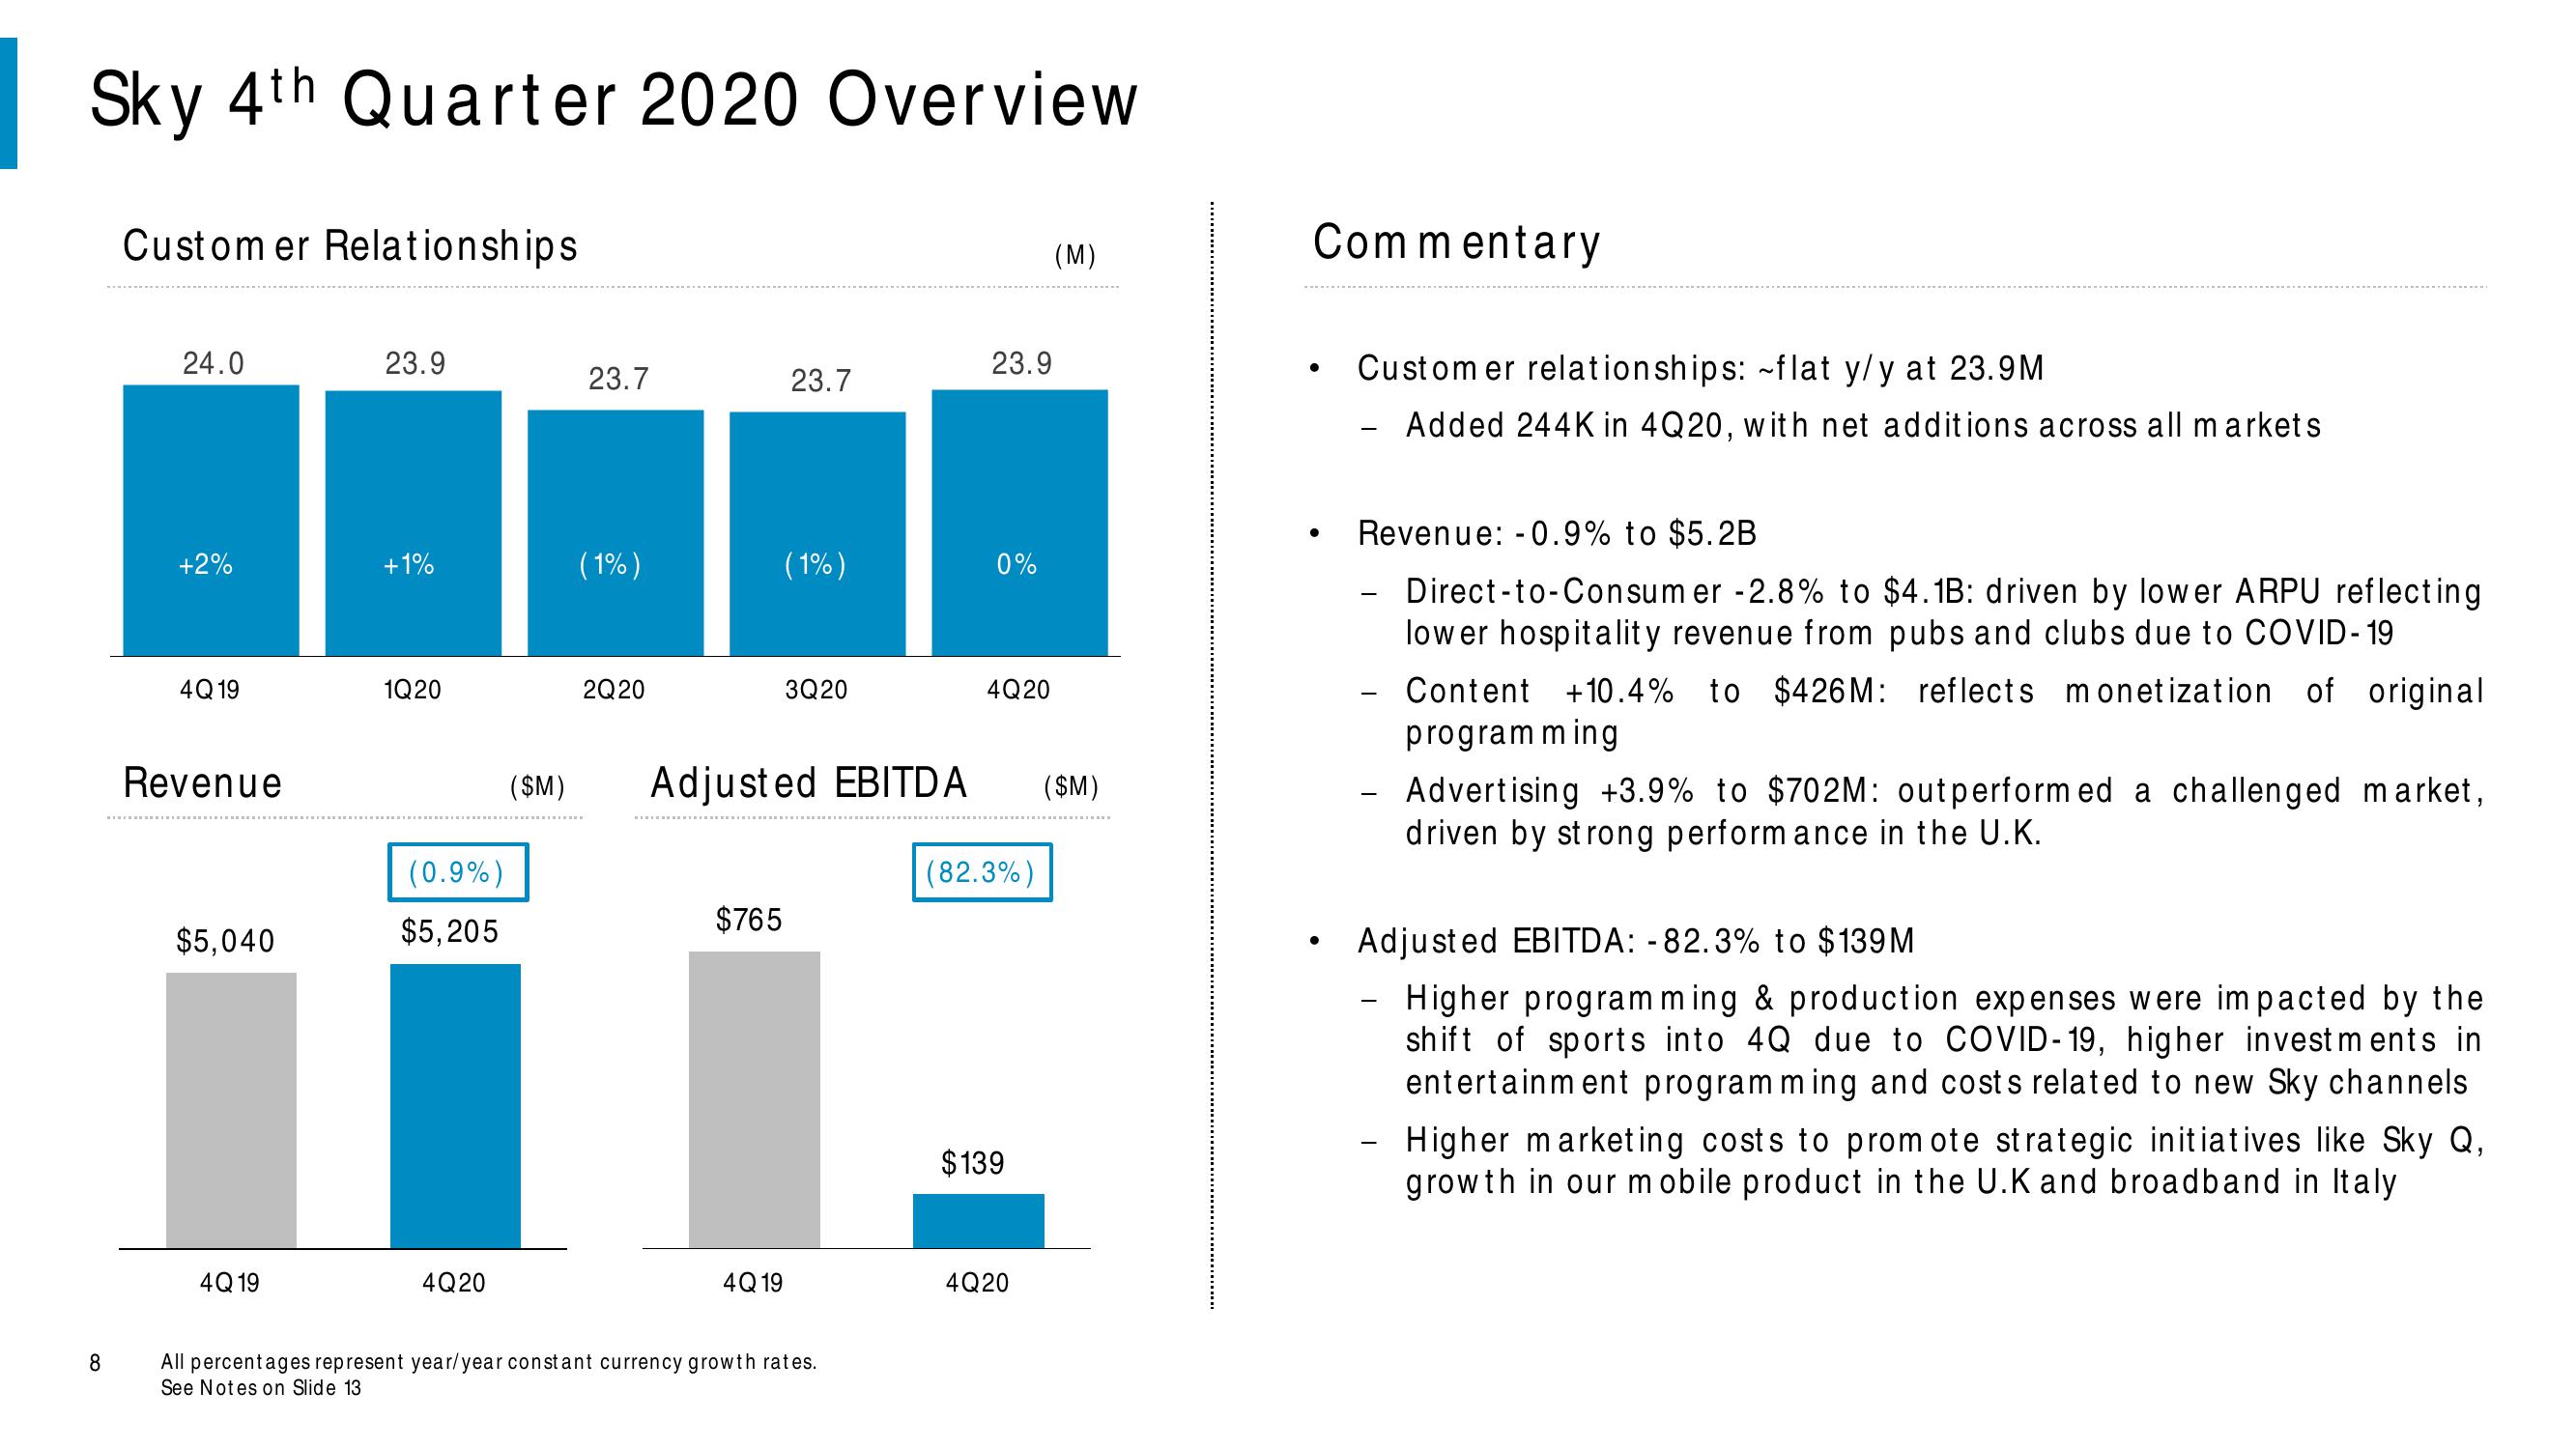
Customer relationships: ~flat y/y at 23.9M
Added 244K in 4Q20, with net additions across all markets
-
Revenue: -0.9% to $5.2B
Direct-to-Consumer -2.8% to $4.1B: driven by lower ARPU reflecting
lower hospitality revenue from pubs and clubs due to COVID-19
Content +10.4% to $426M: reflects monetization of original
programming
Advertising +3.9% to $702M: outperformed a challenged market,
driven by strong performance in the U.K.
-
Adjusted EBITDA: -82.3% to $139M
Higher programming & production expenses were impacted by the
shift of sports into 4Q due to COVID-19, higher investments in
entertainment programming and costs related to new Sky channels
-
- Higher marketing costs to promote strategic initiatives like Sky Q,
growth in our mobile product in the U.K and broadband in ItalyView entire presentation