Blackwells Capital Activist Presentation Deck
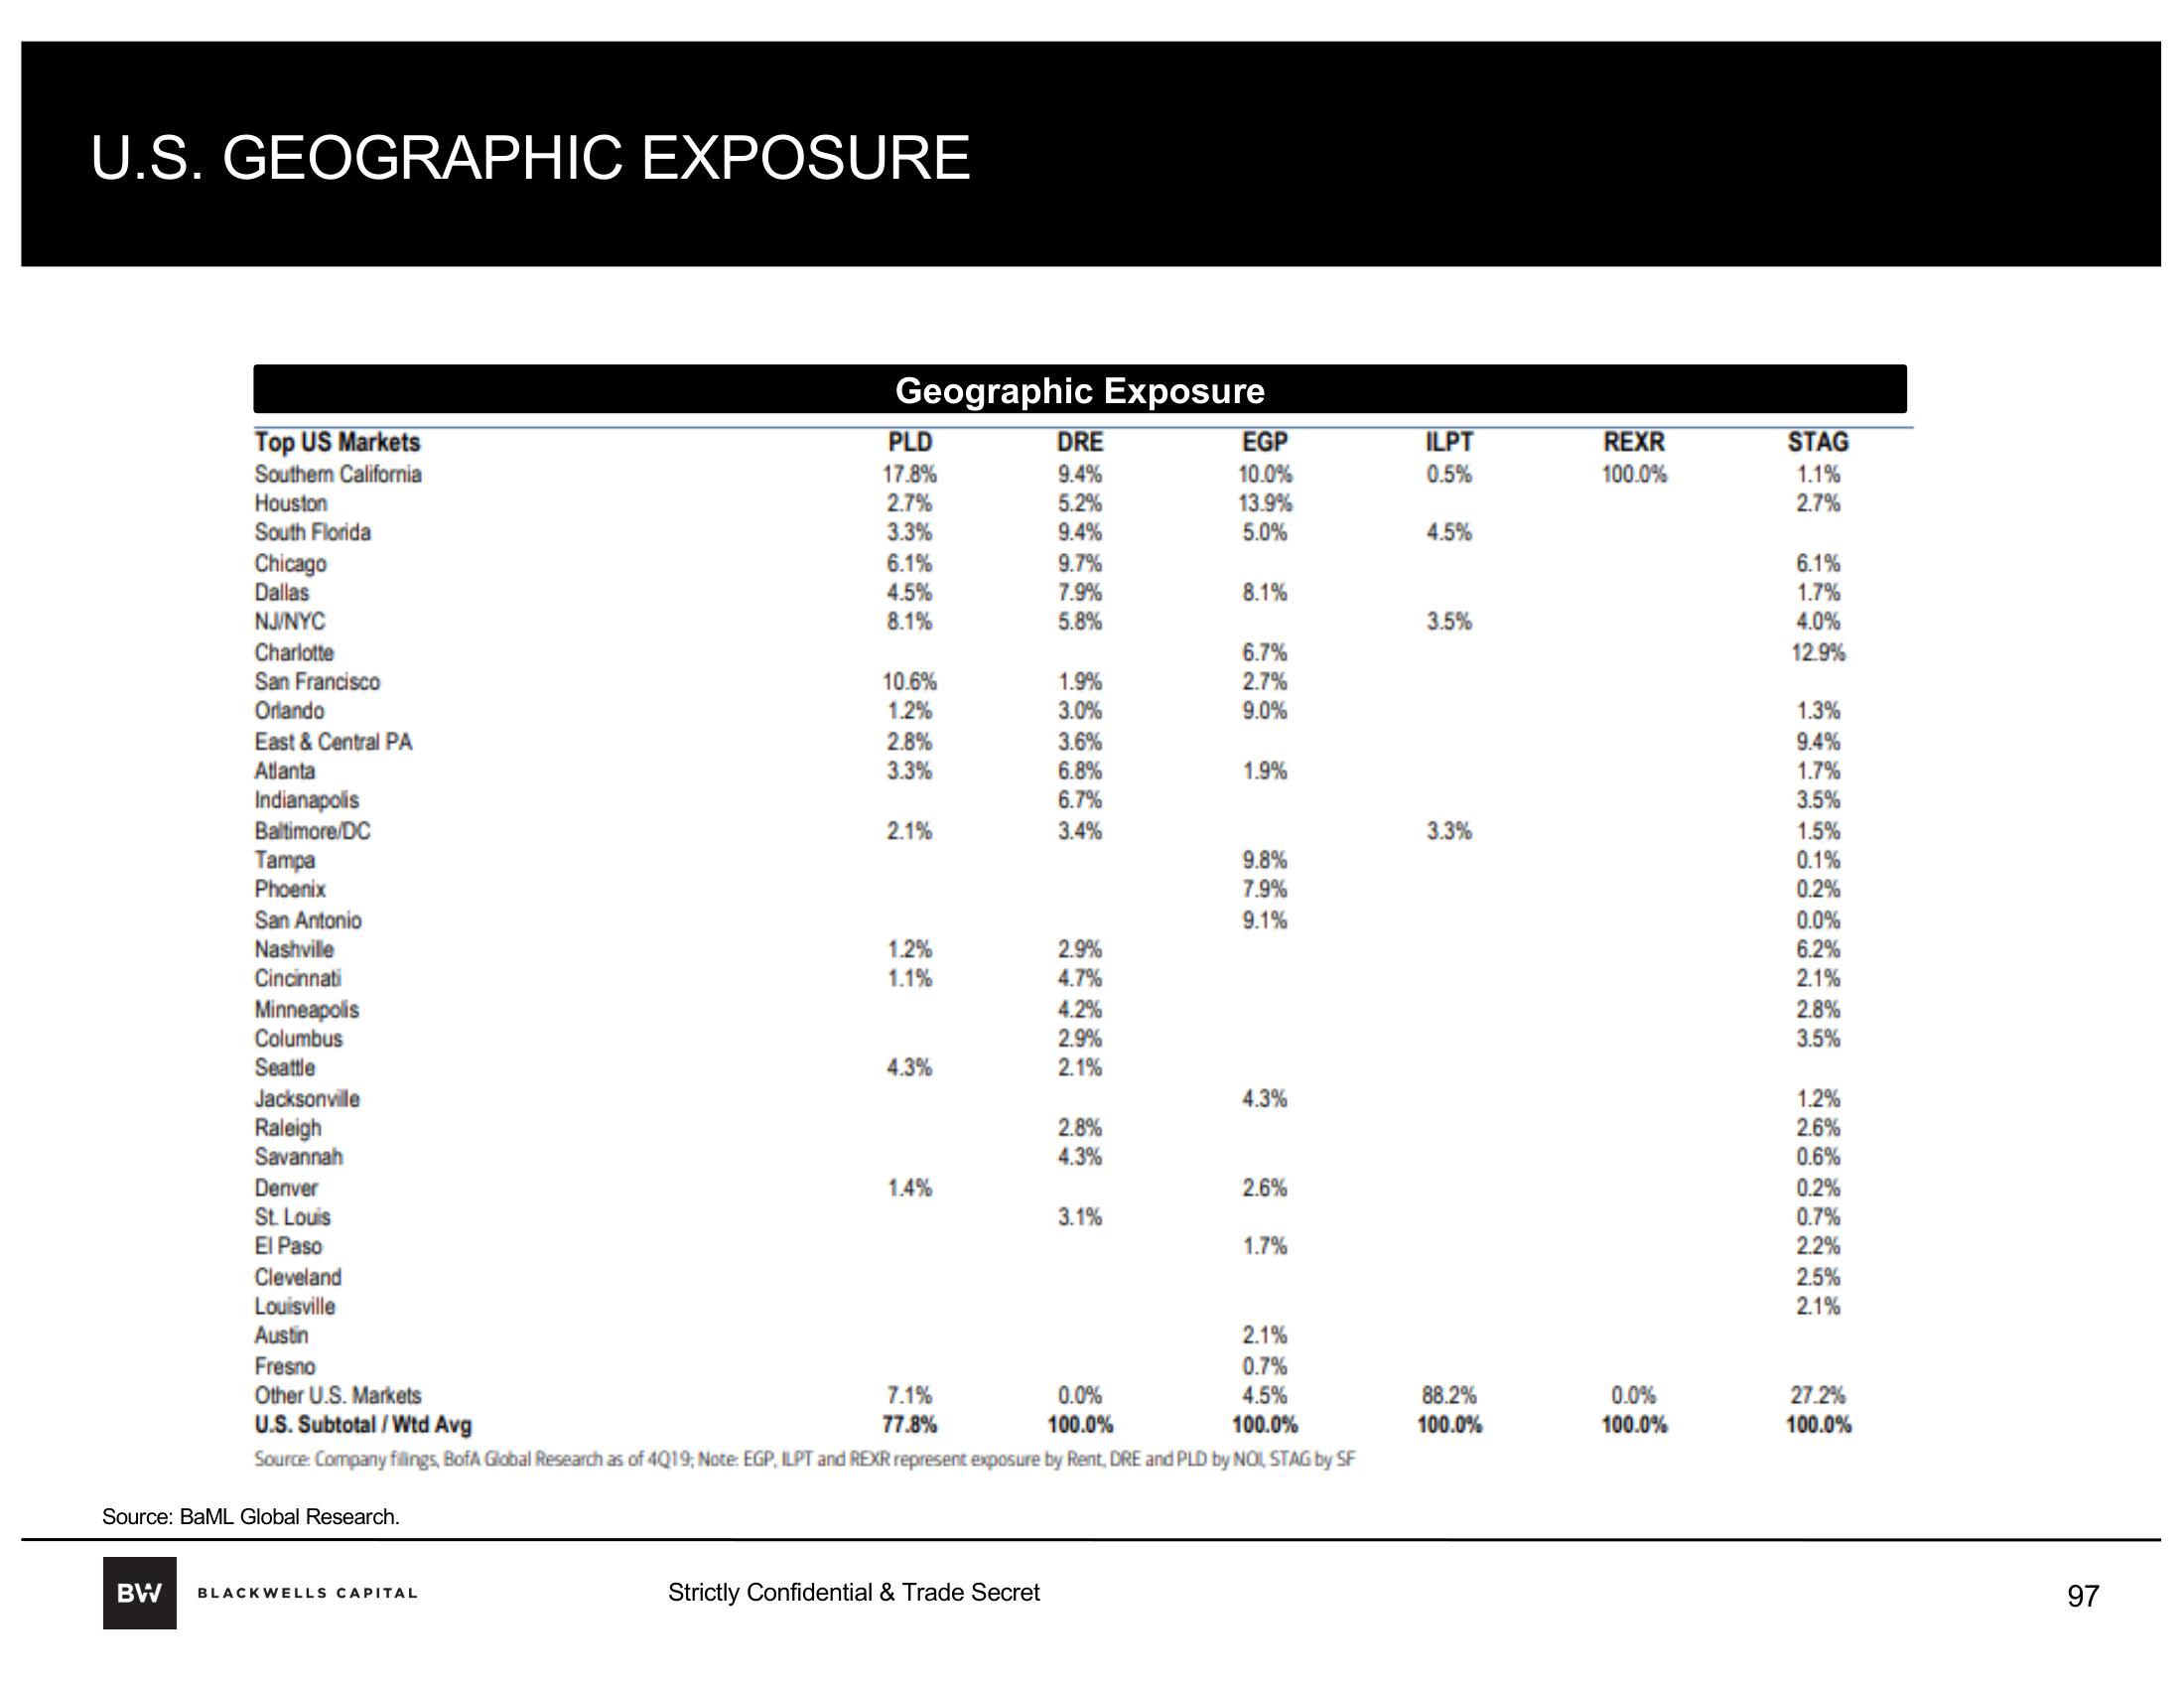
U.S. GEOGRAPHIC EXPOSURE
Top US Markets
Southem California
Houston
South Florida
Chicago
Dallas
NJ/NYC
Charlotte
San Francisco
Orlando
East & Central PA
Atlanta
Indianapolis
Baltimore/DC
Tampa
Phoenix
San Antonio
Nashville
Cincinnati
Minneapolis
Columbus
Seattle
Jacksonville
Raleigh
Savannah
Denver
St. Louis
El Paso
Source: BaML Global Research.
Geographic Exposure
BW BLACKWELLS CAPITAL
PLD
17.8%
2.7%
3.3%
6.1%
4.5%
8.1%
10.6%
1.2%
2.8%
3.3%
2.1%
1.2%
1.1%
4.3%
1.4%
7.1%
77.8%
DRE
9.4%
5.2%
9.4%
Strictly Confidential & Trade Secret
9.7%
7.9%
5.8%
1.9%
3.0%
3.6%
6.8%
6.7%
3.4%
2.9%
4.7%
4.2%
2.9%
2.1%
2.8%
4.3%
3.1%
EGP
10.0%
13.9%
5.0%
0.0%
100.0%
8.1%
6.7%
2.7%
9.0%
1.9%
Cleveland
Louisville
Austin
Fresno
Other U.S. Markets
U.S. Subtotal / Wtd Avg
Source: Company filings, BofA Global Research as of 4019; Note: EGP, ILPT and REXR represent exposure by Rent, DRE and PLD by NOI, STAG by SF
9.8%
7.9%
9.1%
4.3%
2.6%
1.7%
2.1%
0.7%
4.5%
100.0%
ILPT
0.5%
4.5%
3.5%
3.3%
88.2%
100.0%
REXR
100.0%
0.0%
100.0%
STAG
1.1%
2.7%
6.1%
1.7%
4.0%
12.9%
1.3%
9.4%
1.7%
3.5%
1.5%
0.1%
0.2%
0.0%
6.2%
2.1%
2.8%
3.5%
1.2%
2.6%
0.6%
0.2%
0.7%
2.2%
2.5%
2.1%
27.2%
100.0%
97View entire presentation