Apollo Global Management Investor Day Presentation Deck
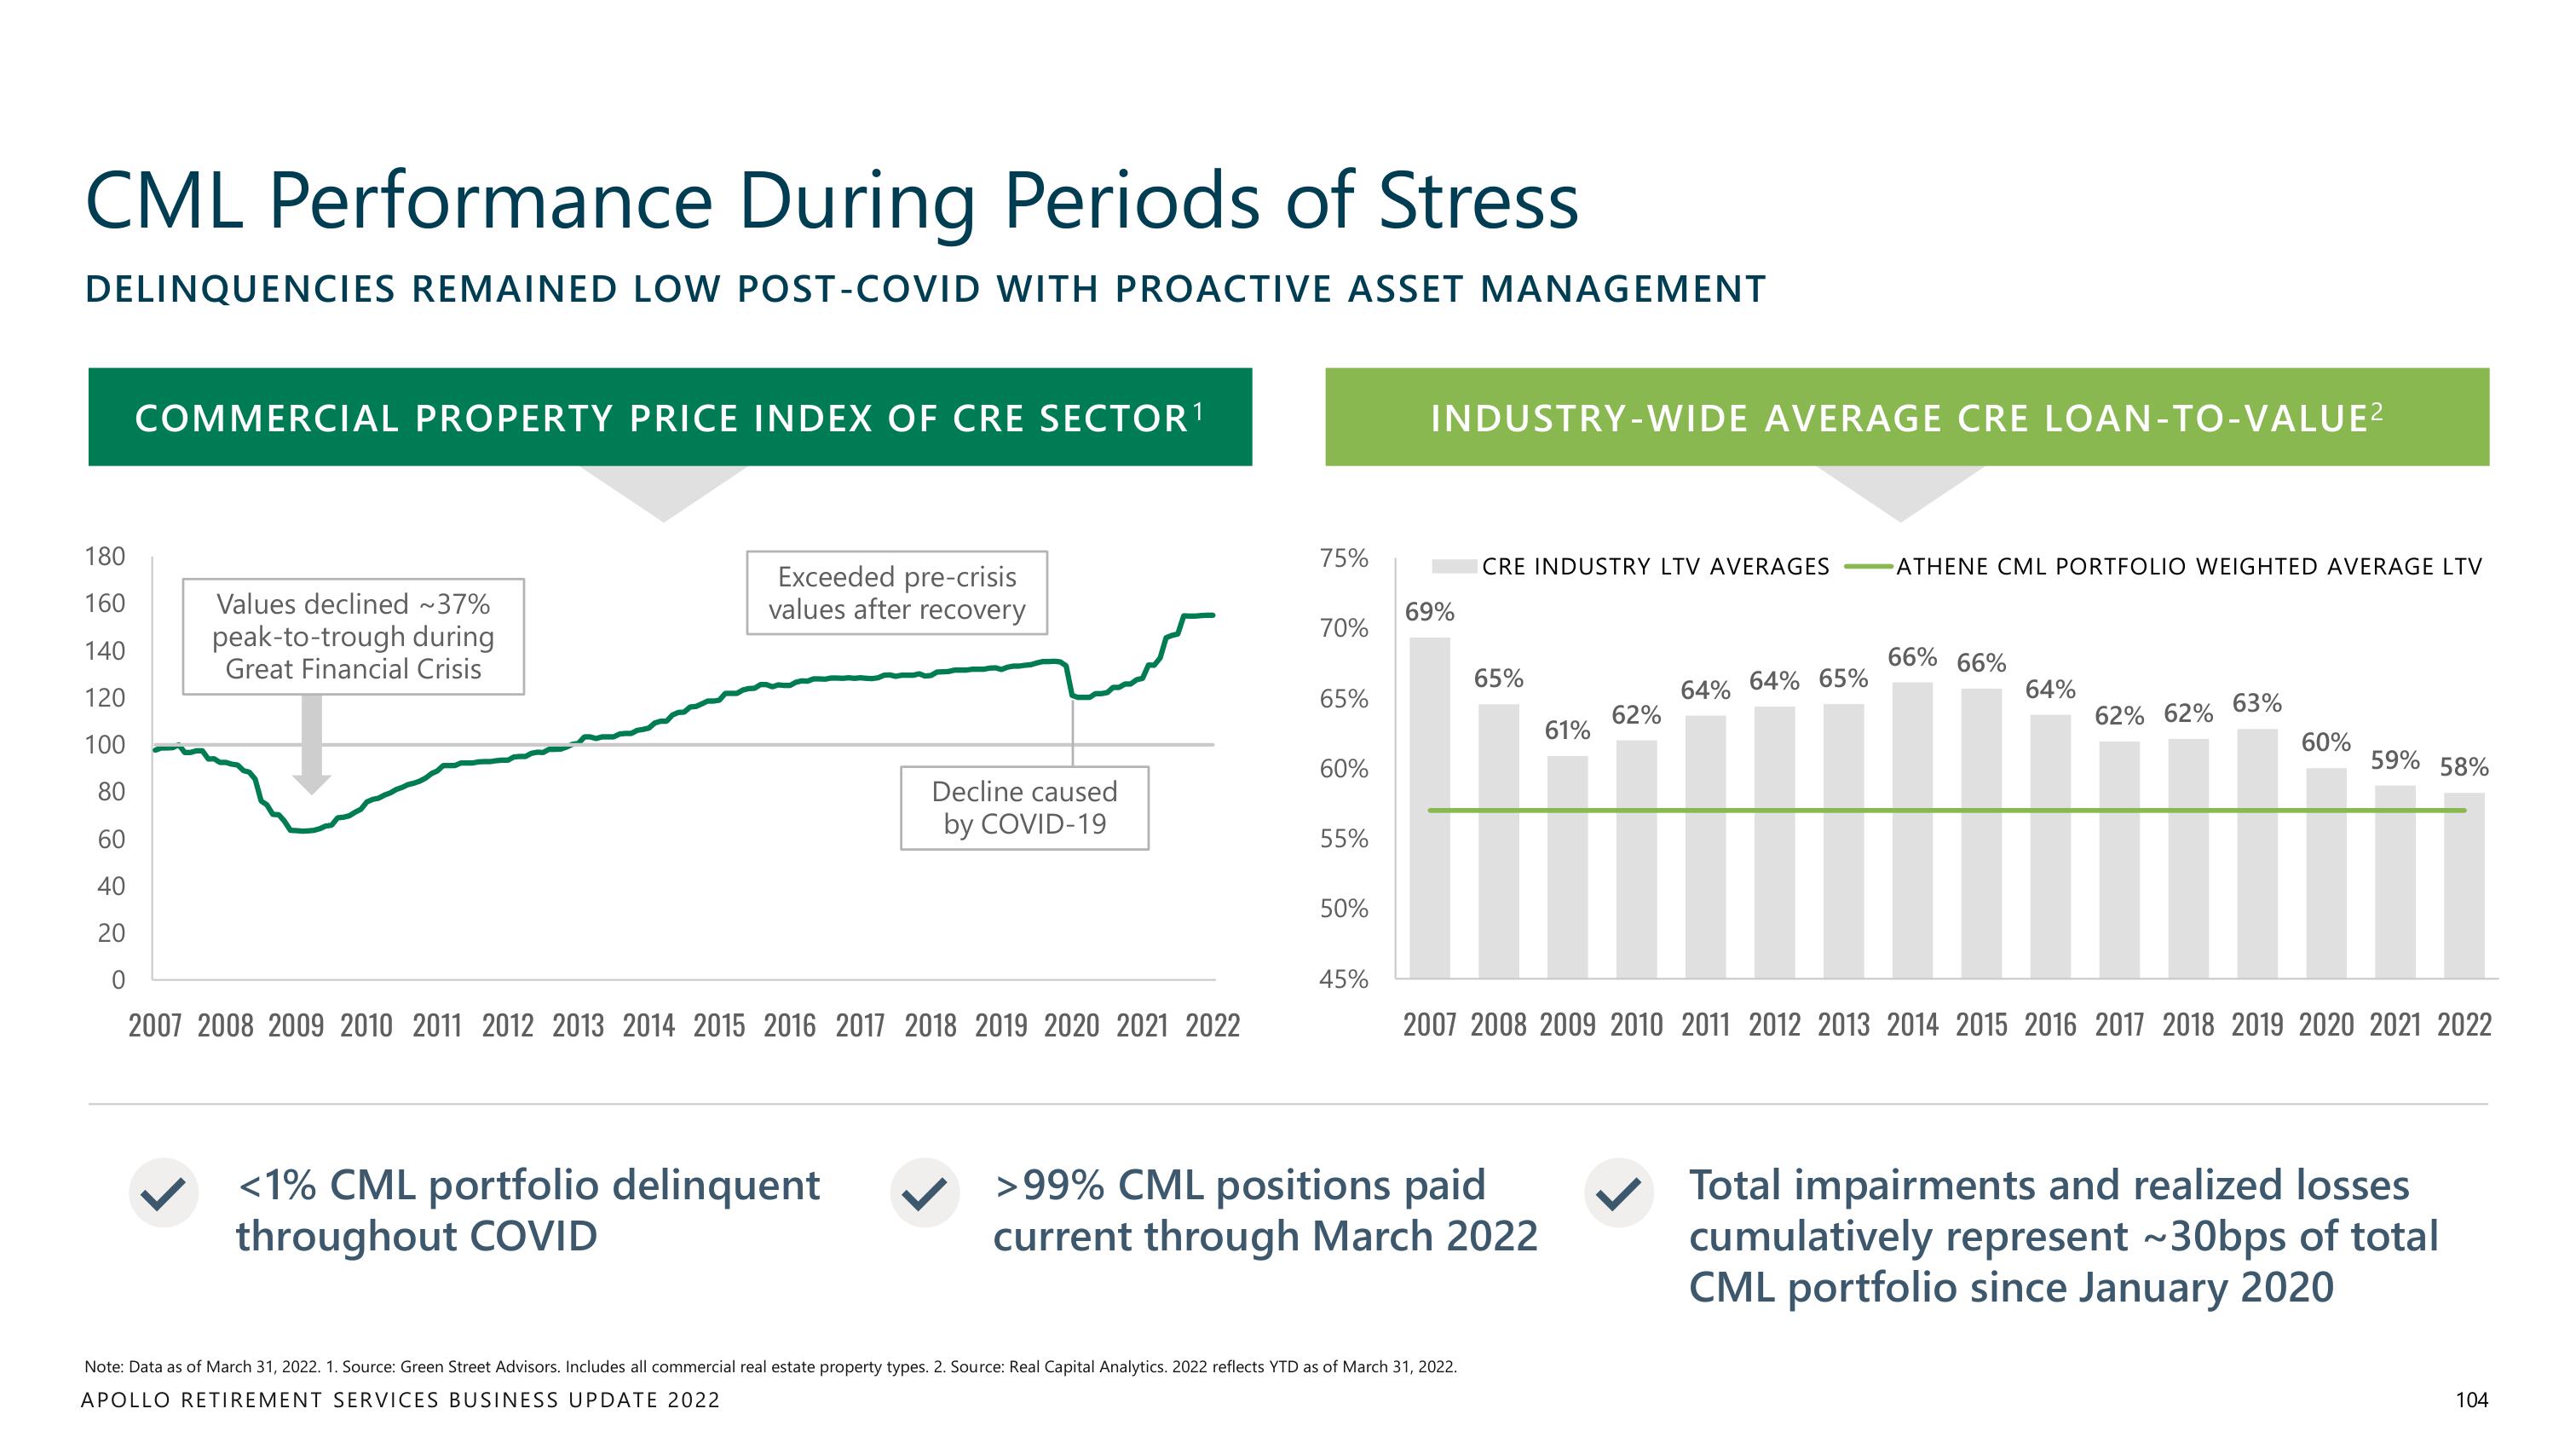
CML Performance During Periods of Stress
DELINQUENCIES REMAINED LOW POST-COVID WITH PROACTIVE ASSET MANAGEMENT
180
160
140
120
100
80
60
40
20
0
COMMERCIAL PROPERTY PRICE INDEX OF CRE SECTOR ¹
Values declined ~37%
peak-to-trough during
Great Financial Crisis
Exceeded pre-crisis
values after recovery
Decline caused
by COVID-19
2007 2008 2009 2010 2011 2012 2013 2014 2015 2016 2017 2018 2019 2020 2021 2022
<1% CML portfolio delinquent
throughout COVID
75%
70%
65%
60%
55%
50%
45%
INDUSTRY-WIDE AVERAGE CRE LOAN-TO-VALUE²
69%
CRE INDUSTRY LTV AVERAGES
65%
Note: Data as of March 31, 2022. 1. Source: Green Street Advisors. Includes all commercial real estate property types. 2. Source: Real Capital Analytics. 2022 reflects YTD as of March 31, 2022.
APOLLO RETIREMENT SERVICES BUSINESS UPDATE 2022
>99% CML positions paid
current through March 2022
61%
62%
64% 64% 65%
ATHENE CML PORTFOLIO WEIGHTED AVERAGE LTV
66% 66%
64%
62% 62% 63%
60%
2007 2008 2009 2010 2011 2012 2013 2014 2015 2016 2017 2018 2019 2020 2021 2022
59% 58%
Total impairments and realized losses
cumulatively represent ~30bps of total
CML portfolio since January 2020
104View entire presentation