J.P.Morgan Results Presentation Deck
JPMORGAN CHASE & CO.
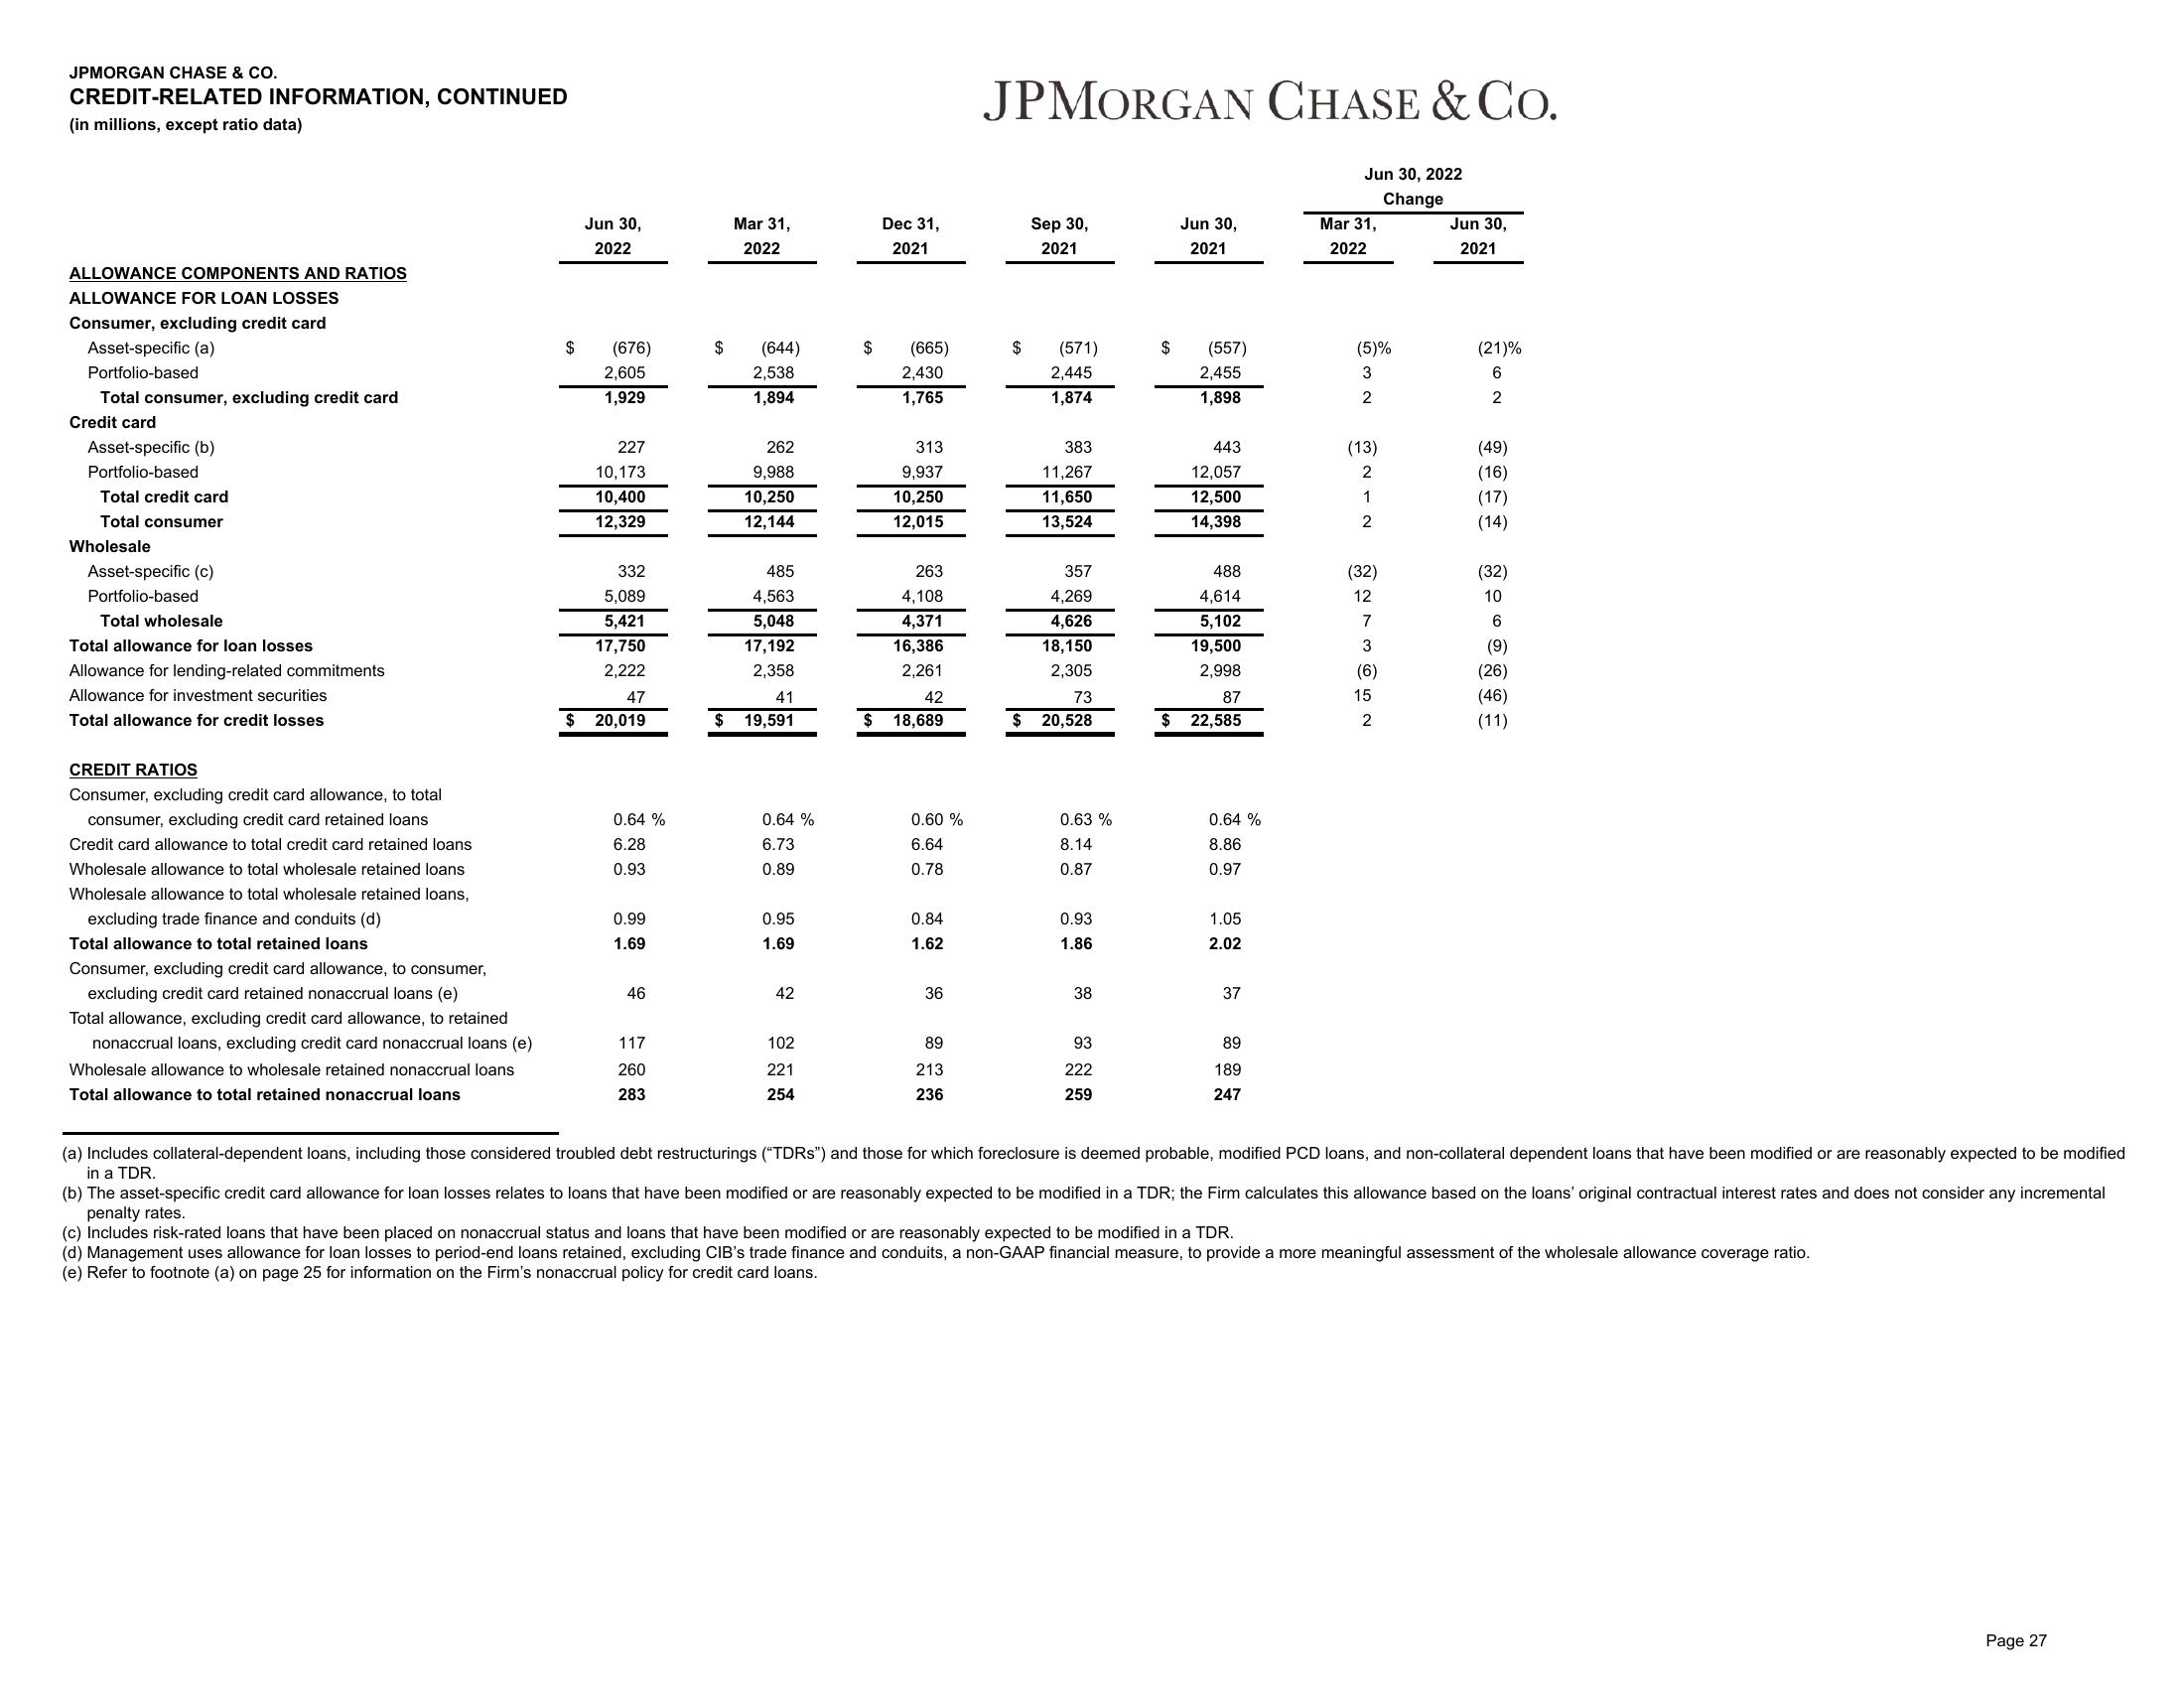
CREDIT-RELATED INFORMATION, CONTINUED
(in millions, except ratio data)
ALLOWANCE COMPONENTS AND RATIOS
ALLOWANCE FOR LOAN LOSSES
Consumer, excluding credit card
Asset-specific (a)
Portfolio-based
Total consumer, excluding credit card
Credit card
Asset-specific (b)
Portfolio-based
Total credit card
Total consumer
Wholesale
Asset-specific (c)
Portfolio-based
Total wholesale
Total allowance for loan losses
Allowance for lending-related commitments
Allowance for investment securities
Total allowance for credit losses
CREDIT RATIOS
Consumer, excluding credit card allowance, to total
consumer, excluding credit card retained loans
Credit card allowance to total credit card retained loans
Wholesale allowance to total wholesale retained loans
Wholesale allowance to total wholesale retained loans,
excluding trade finance and conduits (d)
Total allowance to total retained loans
Consumer, excluding credit card allowance, to consumer,
excluding credit card retained nonaccrual loans (e)
Total allowance, excluding credit card allowance, to retained
nonaccrual loans, excluding credit card nonaccrual loans (e)
Wholesale allowance to wholesale retained nonaccrual loans
Total allowance to total retained nonaccrual loans
$
Jun 30,
2022
(676)
2,605
1,929
227
10,173
10,400
12,329
332
5,089
5,421
17,750
2,222
47
20,019
0.64 %
6.28
0.93
0.99
1.69
46
117
260
283
Mar 31,
2022
(644)
2,538
1,894
262
9,988
10,250
12,144
485
4,563
5,048
17,192
2,358
41
$ 19,591
0.64 %
6.73
0.89
0.95
1.69
42
102
221
254
$
Dec 31,
2021
(665)
2,430
1,765
313
9,937
10,250
12,015
263
4,108
4,371
16,386
2,261
42
$ 18,689
0.60 %
6.64
0.78
0.84
1.62
36
89
213
236
JPMORGAN CHASE & CO.
$
$
Sep 30,
2021
(571)
2,445
1,874
383
11,267
11,650
13,524
357
4,269
4,626
18,150
2,305
73
20,528
0.63 %
8.14
0.87
0.93
1.86
38
93
222
259
$
$
Jun 30,
2021
(557)
2,455
1,898
443
12,057
12,500
14,398
488
4,614
5,102
19,500
2,998
87
22,585
0.64 %
8.86
0.97
1.05
2.02
37
89
189
247
Jun 30, 2022
Change
Mar 31,
2022
(5)%
3
2
(13)
2
1
2
(32)
12
7
3
(6)
15
2
Jun 30,
2021
(21)%
6
2
(49)
(16)
(17)
(14)
(32)
10
6
(9)
(26)
(46)
(11)
(a) Includes collateral-dependent loans, including those considered troubled debt restructurings ("TDRs") and those for which foreclosure is deemed probable, modified PCD loans, and non-collateral dependent loans that have been modified or are reasonably expected to be modified
in a TDR.
(b) The asset-specific credit card allowance for loan losses relates to loans that have been modified or are reasonably expected to be modified in a TDR; the Firm calculates this allowance based on the loans' original contractual interest rates and does not consider any incremental
penalty rates.
(c) Includes risk-rated loans that have been placed on nonaccrual status and loans that have been modified or are reasonably expected to be modified in a TDR.
(d) Management uses allowance for loan losses to period-end loans retained, excluding CIB's trade finance and conduits, a non-GAAP financial measure, to provide a more meaningful assessment of the wholesale allowance coverage ratio.
(e) Refer to footnote (a) on page 25 for information on the Firm's nonaccrual policy for credit card loans.
Page 27View entire presentation