Momentus SPAC Presentation Deck
REVENUE GROWTH
EBITDA' GROWTH
EBITDA' MARGIN
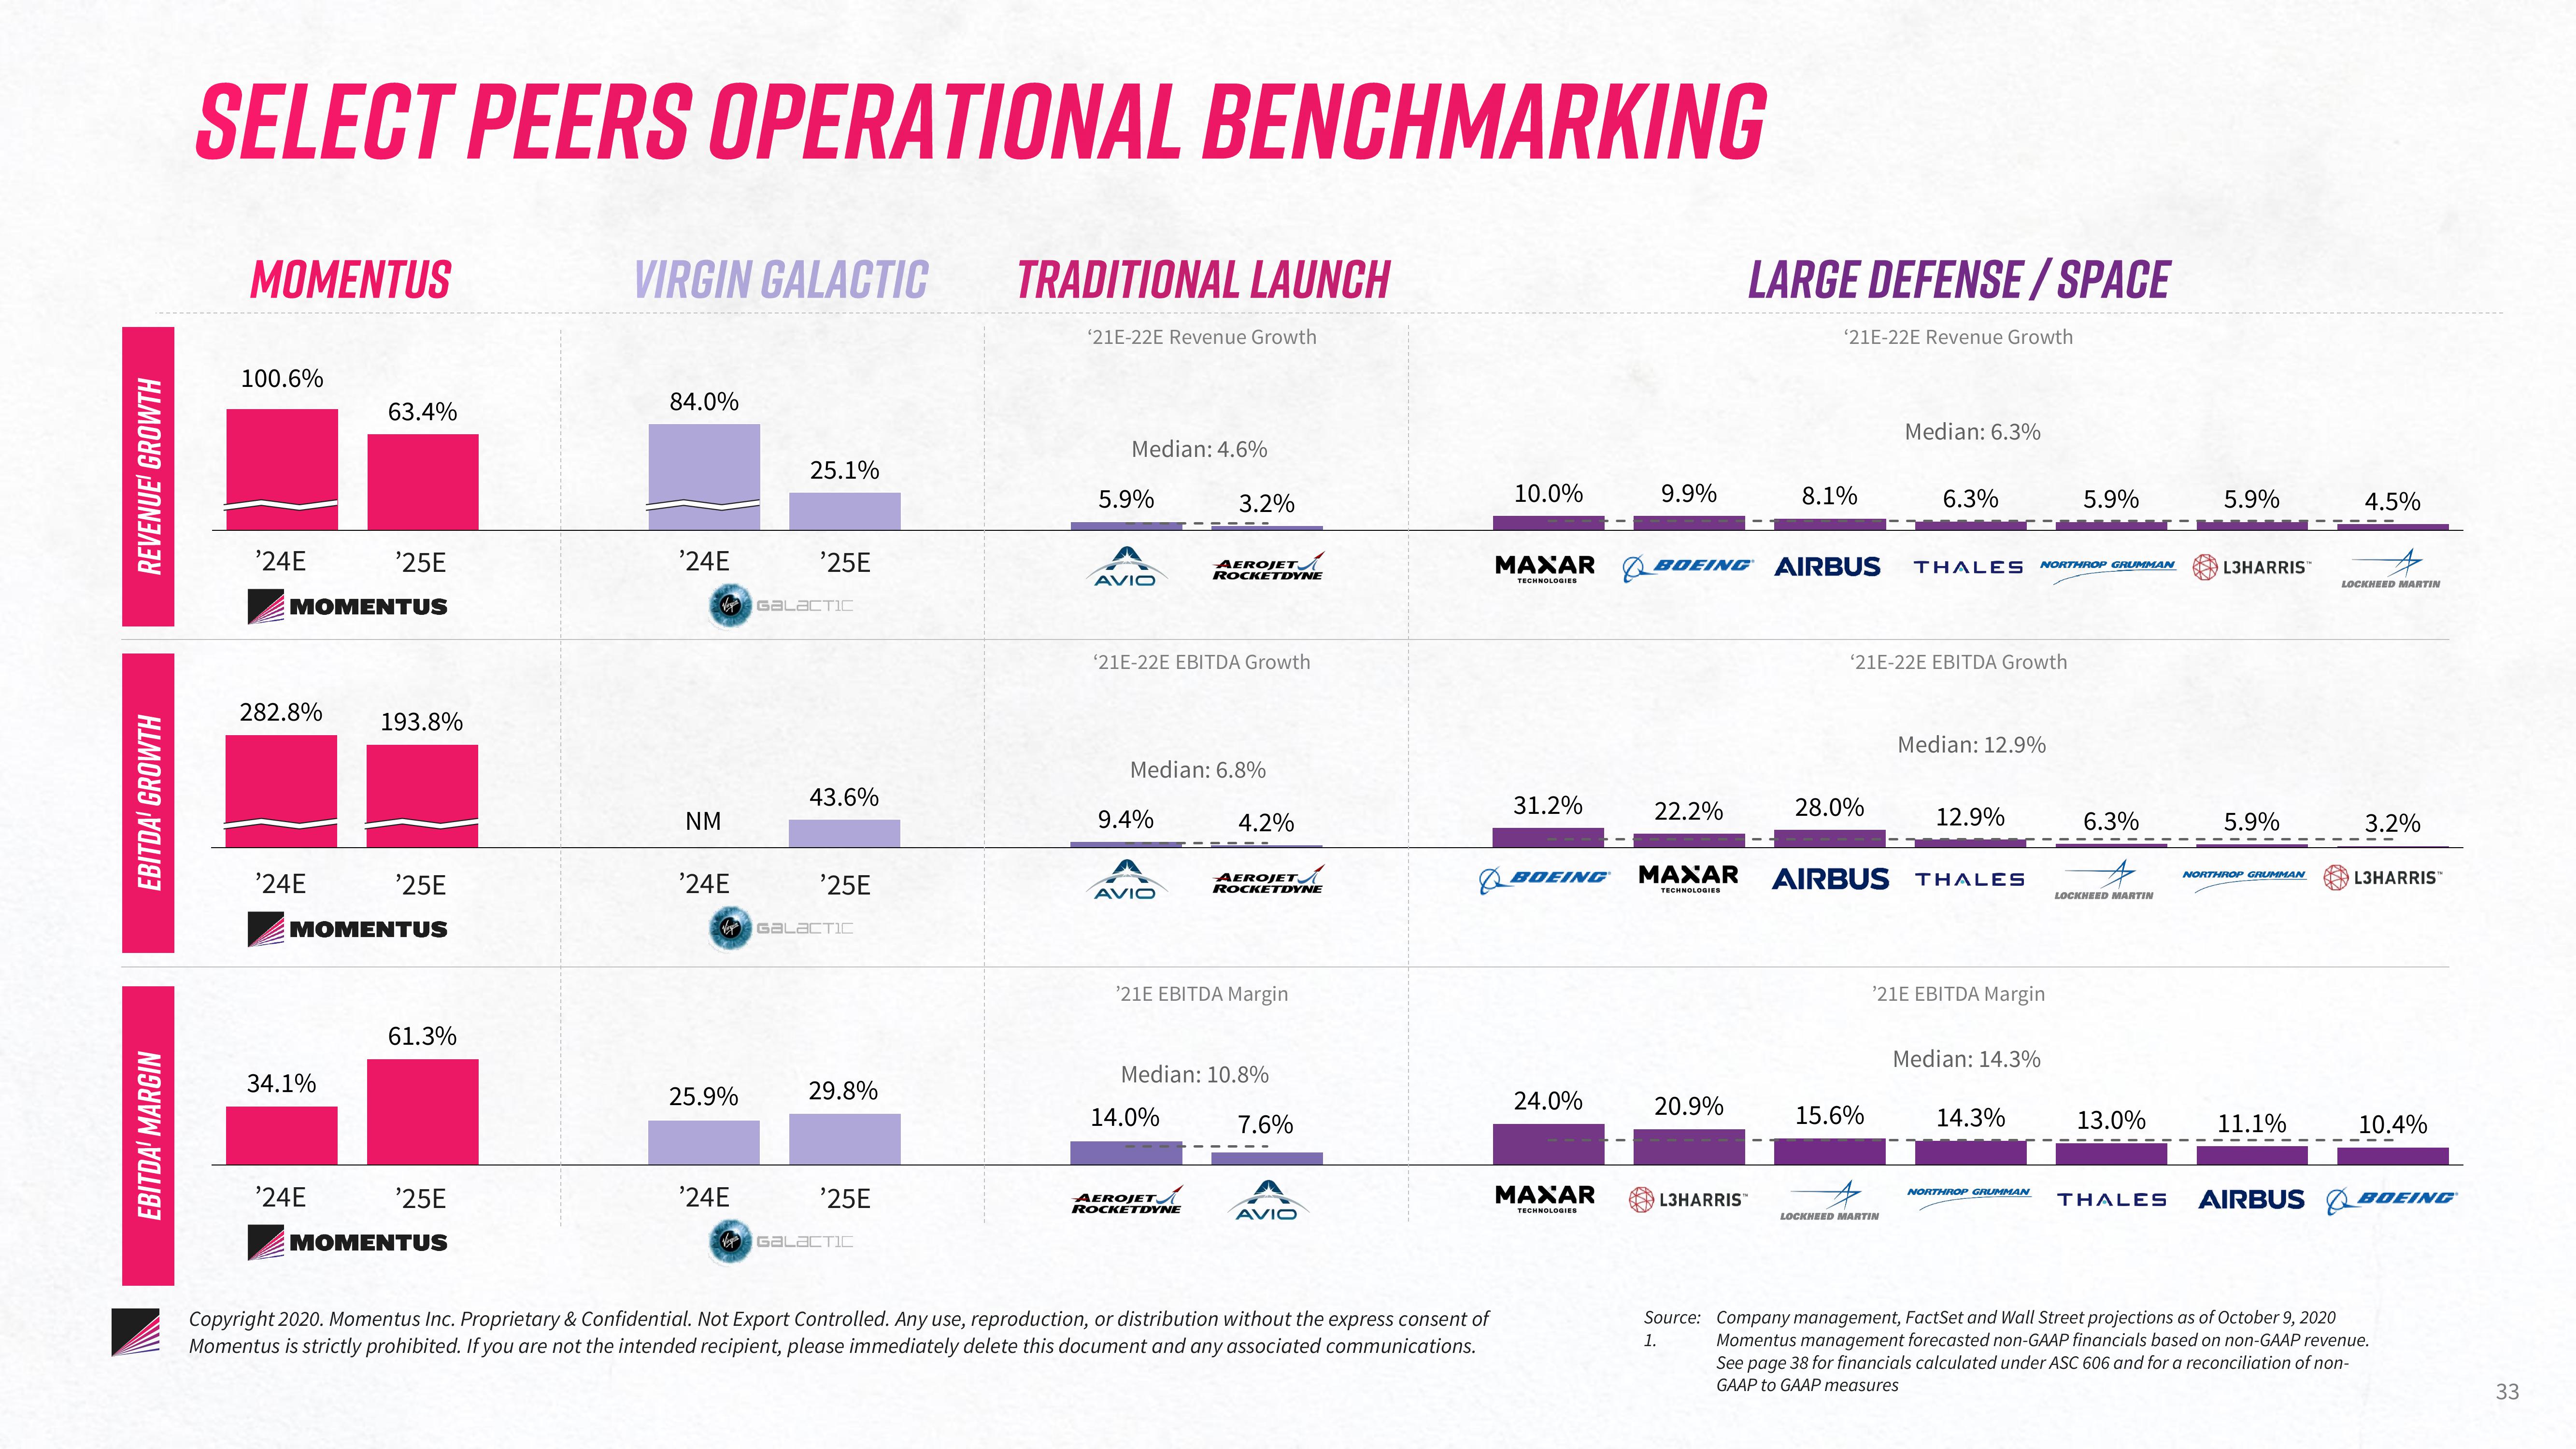
SELECT PEERS OPERATIONAL BENCHMARKING
MOMENTUS
100.6%
'24E
282.8%
MOMENTUS
'24E
63.4%
34.1%
'25E
'24E
193.8%
MOMENTUS
'25E
61.3%
'25E
MOMENTUS
VIRGIN GALACTIC TRADITIONAL LAUNCH
84.0%
'24E
NM
'24E
25.9%
'24E
25.1%
'25E
GALACTIC
43.6%
'25E
GALACTIC
29.8%
'25E
GALACTIC
'21E-22E Revenue Growth
Median: 4.6%
5.9%
AVIO
'21E-22E EBITDA Growth
9.4%
Median: 6.8%
AVIO
3.2%
AEROJET
ROCKETDYNE
14.0%
AEROJET
ROCKETDYNE
4.2%
¹21E EBITDA Margin
AEROJET
ROCKETDYNE
Median: 10.8%
7.6%
AVIO
Copyright 2020. Momentus Inc. Proprietary & Confidential. Not Export Controlled. Any use, reproduction, or distribution without the express consent of
Momentus is strictly prohibited. If you are not the intended recipient, please immediately delete this document and any associated communications.
10.0%
31.2%
BOEING
MAXAR BOEING AIRBUS
TECHNOLOGIES
24.0%
9.9%
MAXAR
TECHNOLOGIES
22.2%
MAXAR
TECHNOLOGIES
LARGE DEFENSE/SPACE
'21E-22E Revenue Growth
20.9%
8.1%
L3HARRIS™
28.0%
Median: 6.3%
'21E-22E EBITDA Growth
15.6%
6.3%
LOCKHEED MARTIN
THALES NORTHROP GRUMMAN
Median: 12.9%
AIRBUS THALES
12.9%
'21E EBITDA Margin
Median: 14.3%
14.3%
5.9%
NORTHROP GRUMMAN
6.3%
LOCKHEED MARTIN
13.0%
5.9%
L3HARRIS™
5.9%
NORTHROP GRUMMAN
11.1%
4.5%
LOCKHEED MARTIN
3.2%
L3HARRIS
10.4%
THALES AIRBUS BOEING
1.
Source: Company management, FactSet and Wall Street projections as of October 9, 2020
Momentus management forecasted non-GAAP financials based on non-GAAP revenue.
See page 38 for financials calculated under ASC 606 and for a reconciliation of non-
GAAP to GAAP measures
33View entire presentation