Estithmar - 2022 Company Snapshot
Revenue
(QAR millions)
Revenue
(QAR millions)
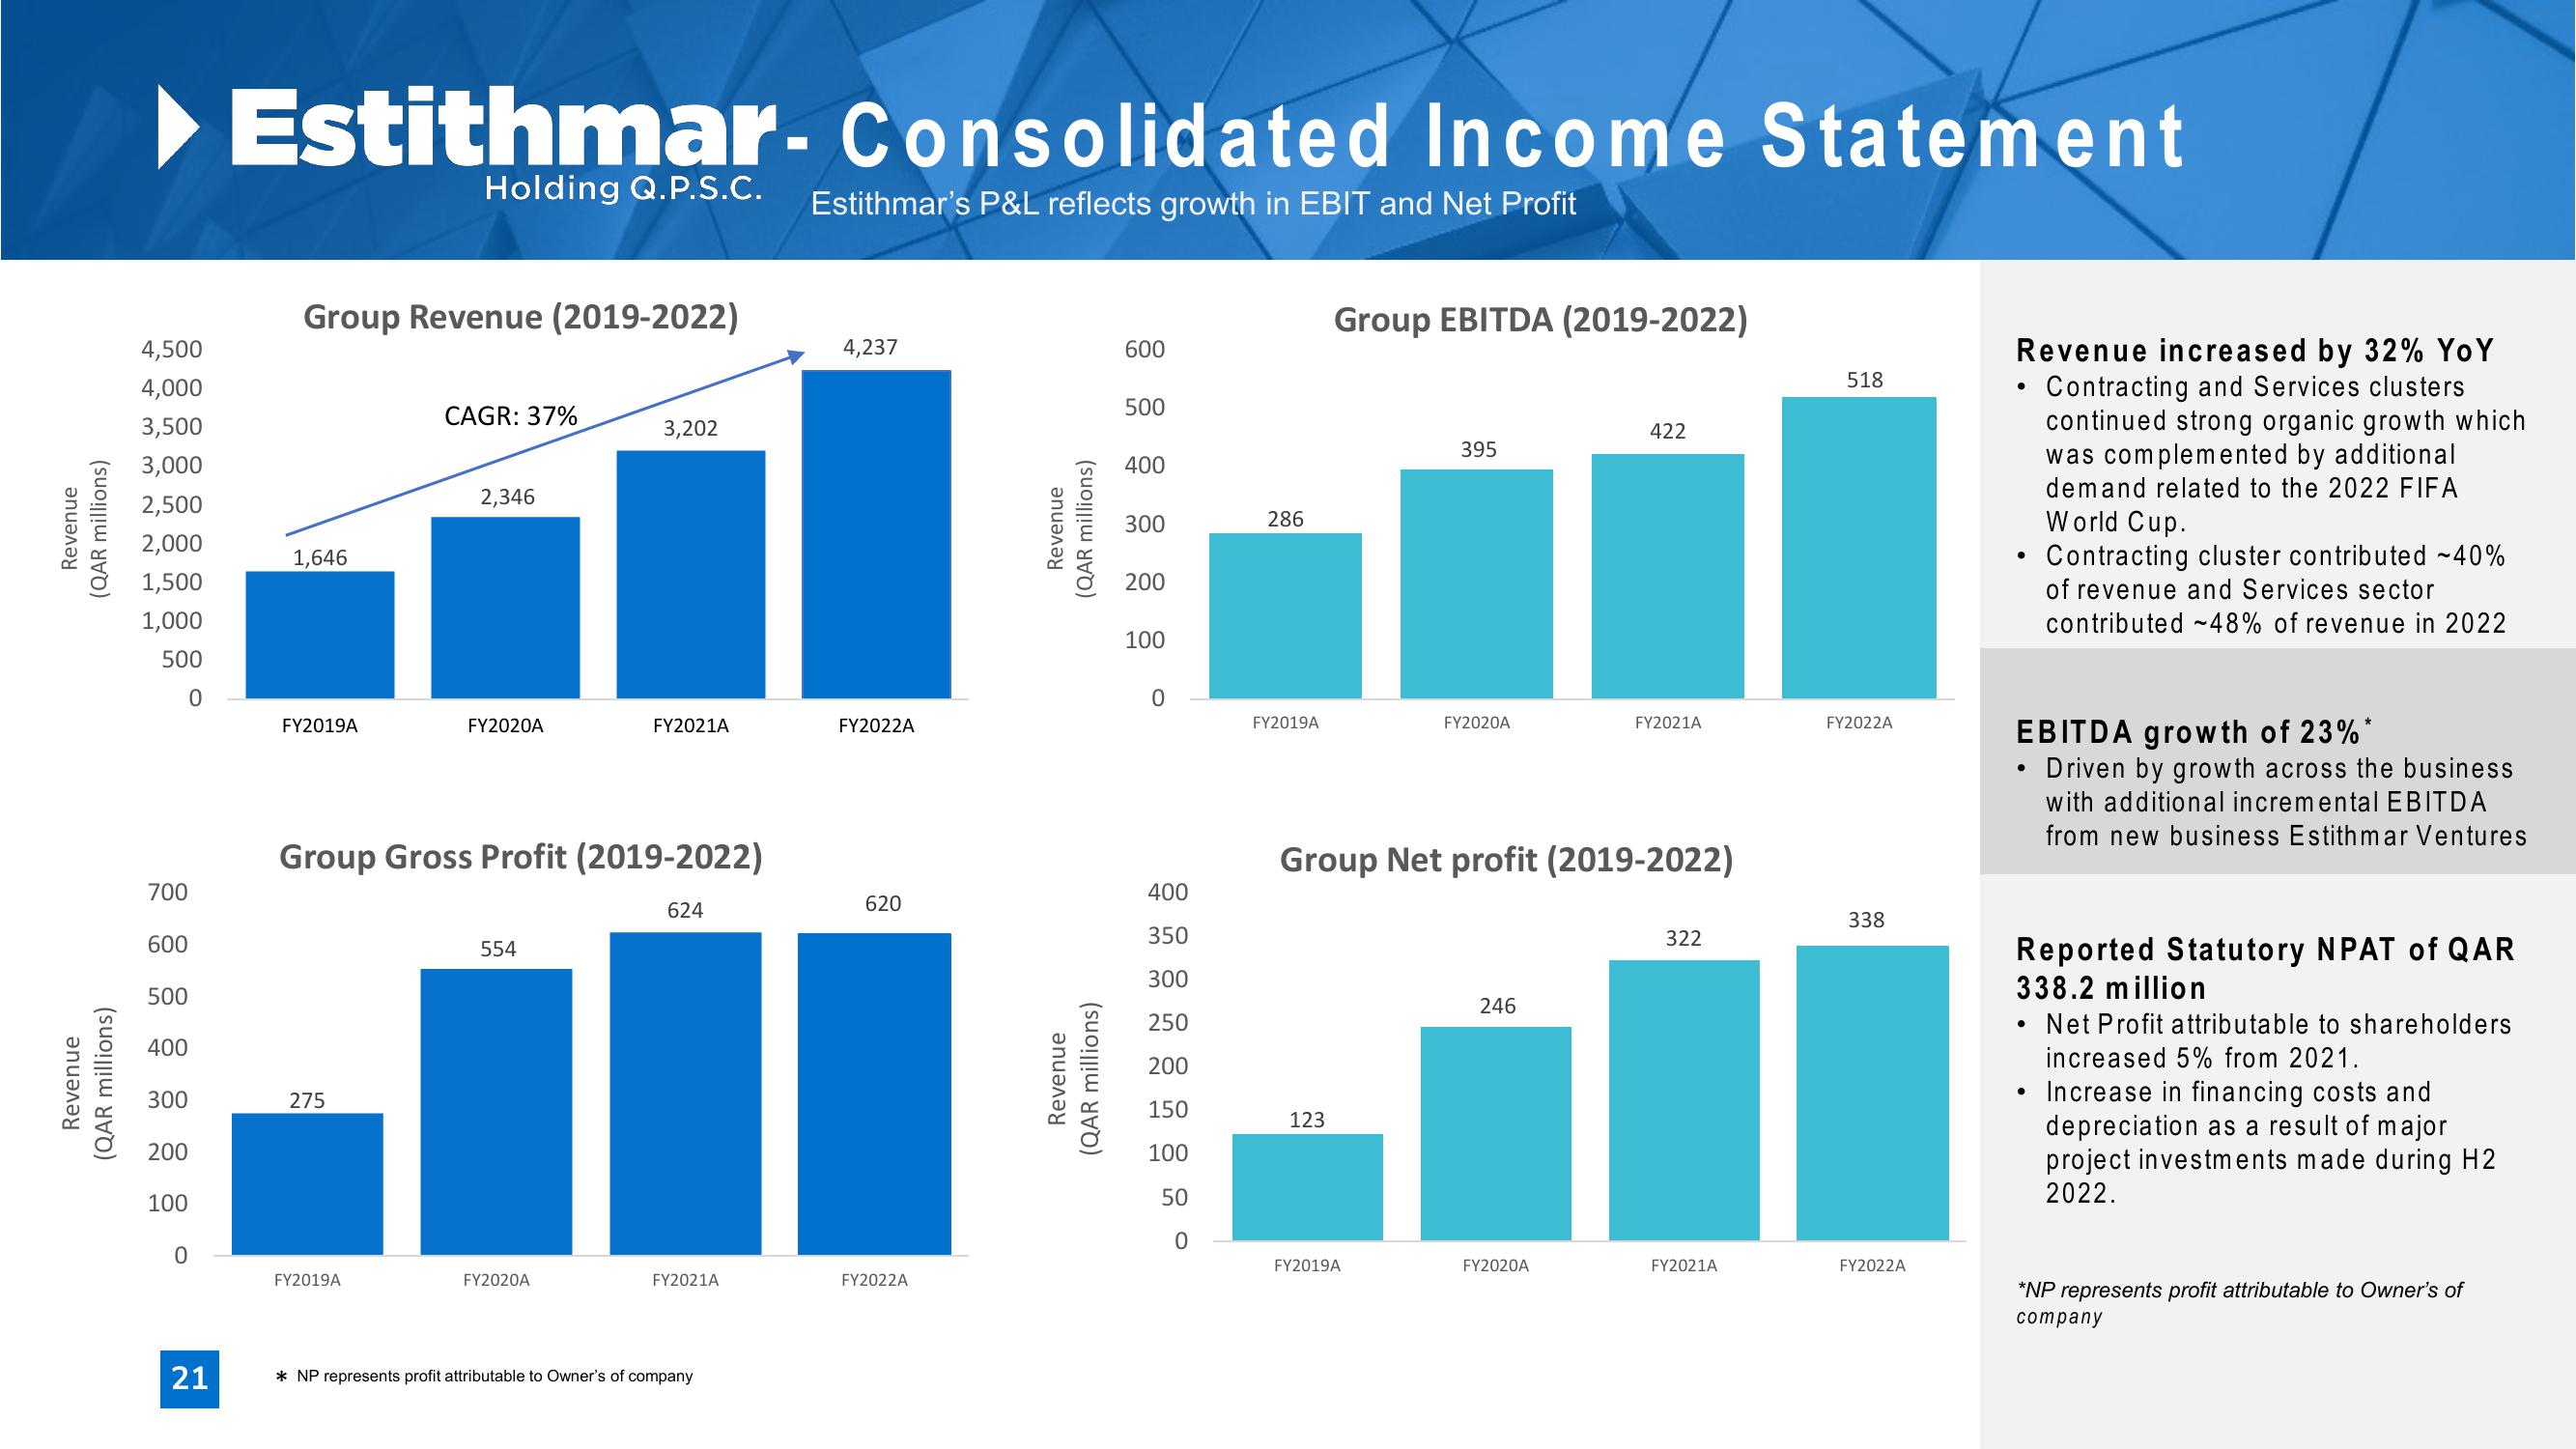
Estithmar- Consolidated Income Statement
Holding Q.P.S.C.
Estithmar's P&L reflects growth in EBIT and Net Profit
Group Revenue (2019-2022)
Group EBITDA (2019-2022)
4,500
4,237
600
4,000
518
3,500
CAGR: 37%
3,202
500
422
395
3,000
2,500
2,000
1,500
1,000
2,346
1,646
Revenue
(QAR millions)
400
300
286
200
100
500
0
0
FY2019A
FY2020A
FY2021A
FY2022A
FY2019A
FY2020A
FY2021A
FY2022A
Group Gross Profit (2019-2022)
Group Net profit (2019-2022)
700
600
500
400
300
275
200
400
620
624
338
350
322
554
300
Revenue
(QAR millions)
246
250
200
150
123
100
50
100
0
0
FY2019A
FY2020A
FY2021A
FY2022A
FY2019A
FY2020A
FY2021A
FY2022A
21
* NP represents profit attributable to Owner's of company
Revenue increased by 32% YoY
Contracting and Services clusters
continued strong organic growth which
was complemented by additional
demand related to the 2022 FIFA
World Cup.
• Contracting cluster contributed ~40%
of revenue and Services sector
contributed -48% of revenue in 2022
•
EBITDA growth of 23%*
Driven by growth across the business
with additional incremental EBITDA
from new business Estithmar Ventures
Reported Statutory NPAT of QAR
338.2 million
•
Net Profit attributable to shareholders
increased 5% from 2021.
Increase in financing costs and
depreciation as a result of major
project investments made during H2
2022.
*NP represents profit attributable to Owner's of
companyView entire presentation