Inovalon Results Presentation Deck
Continued Growth Momentum
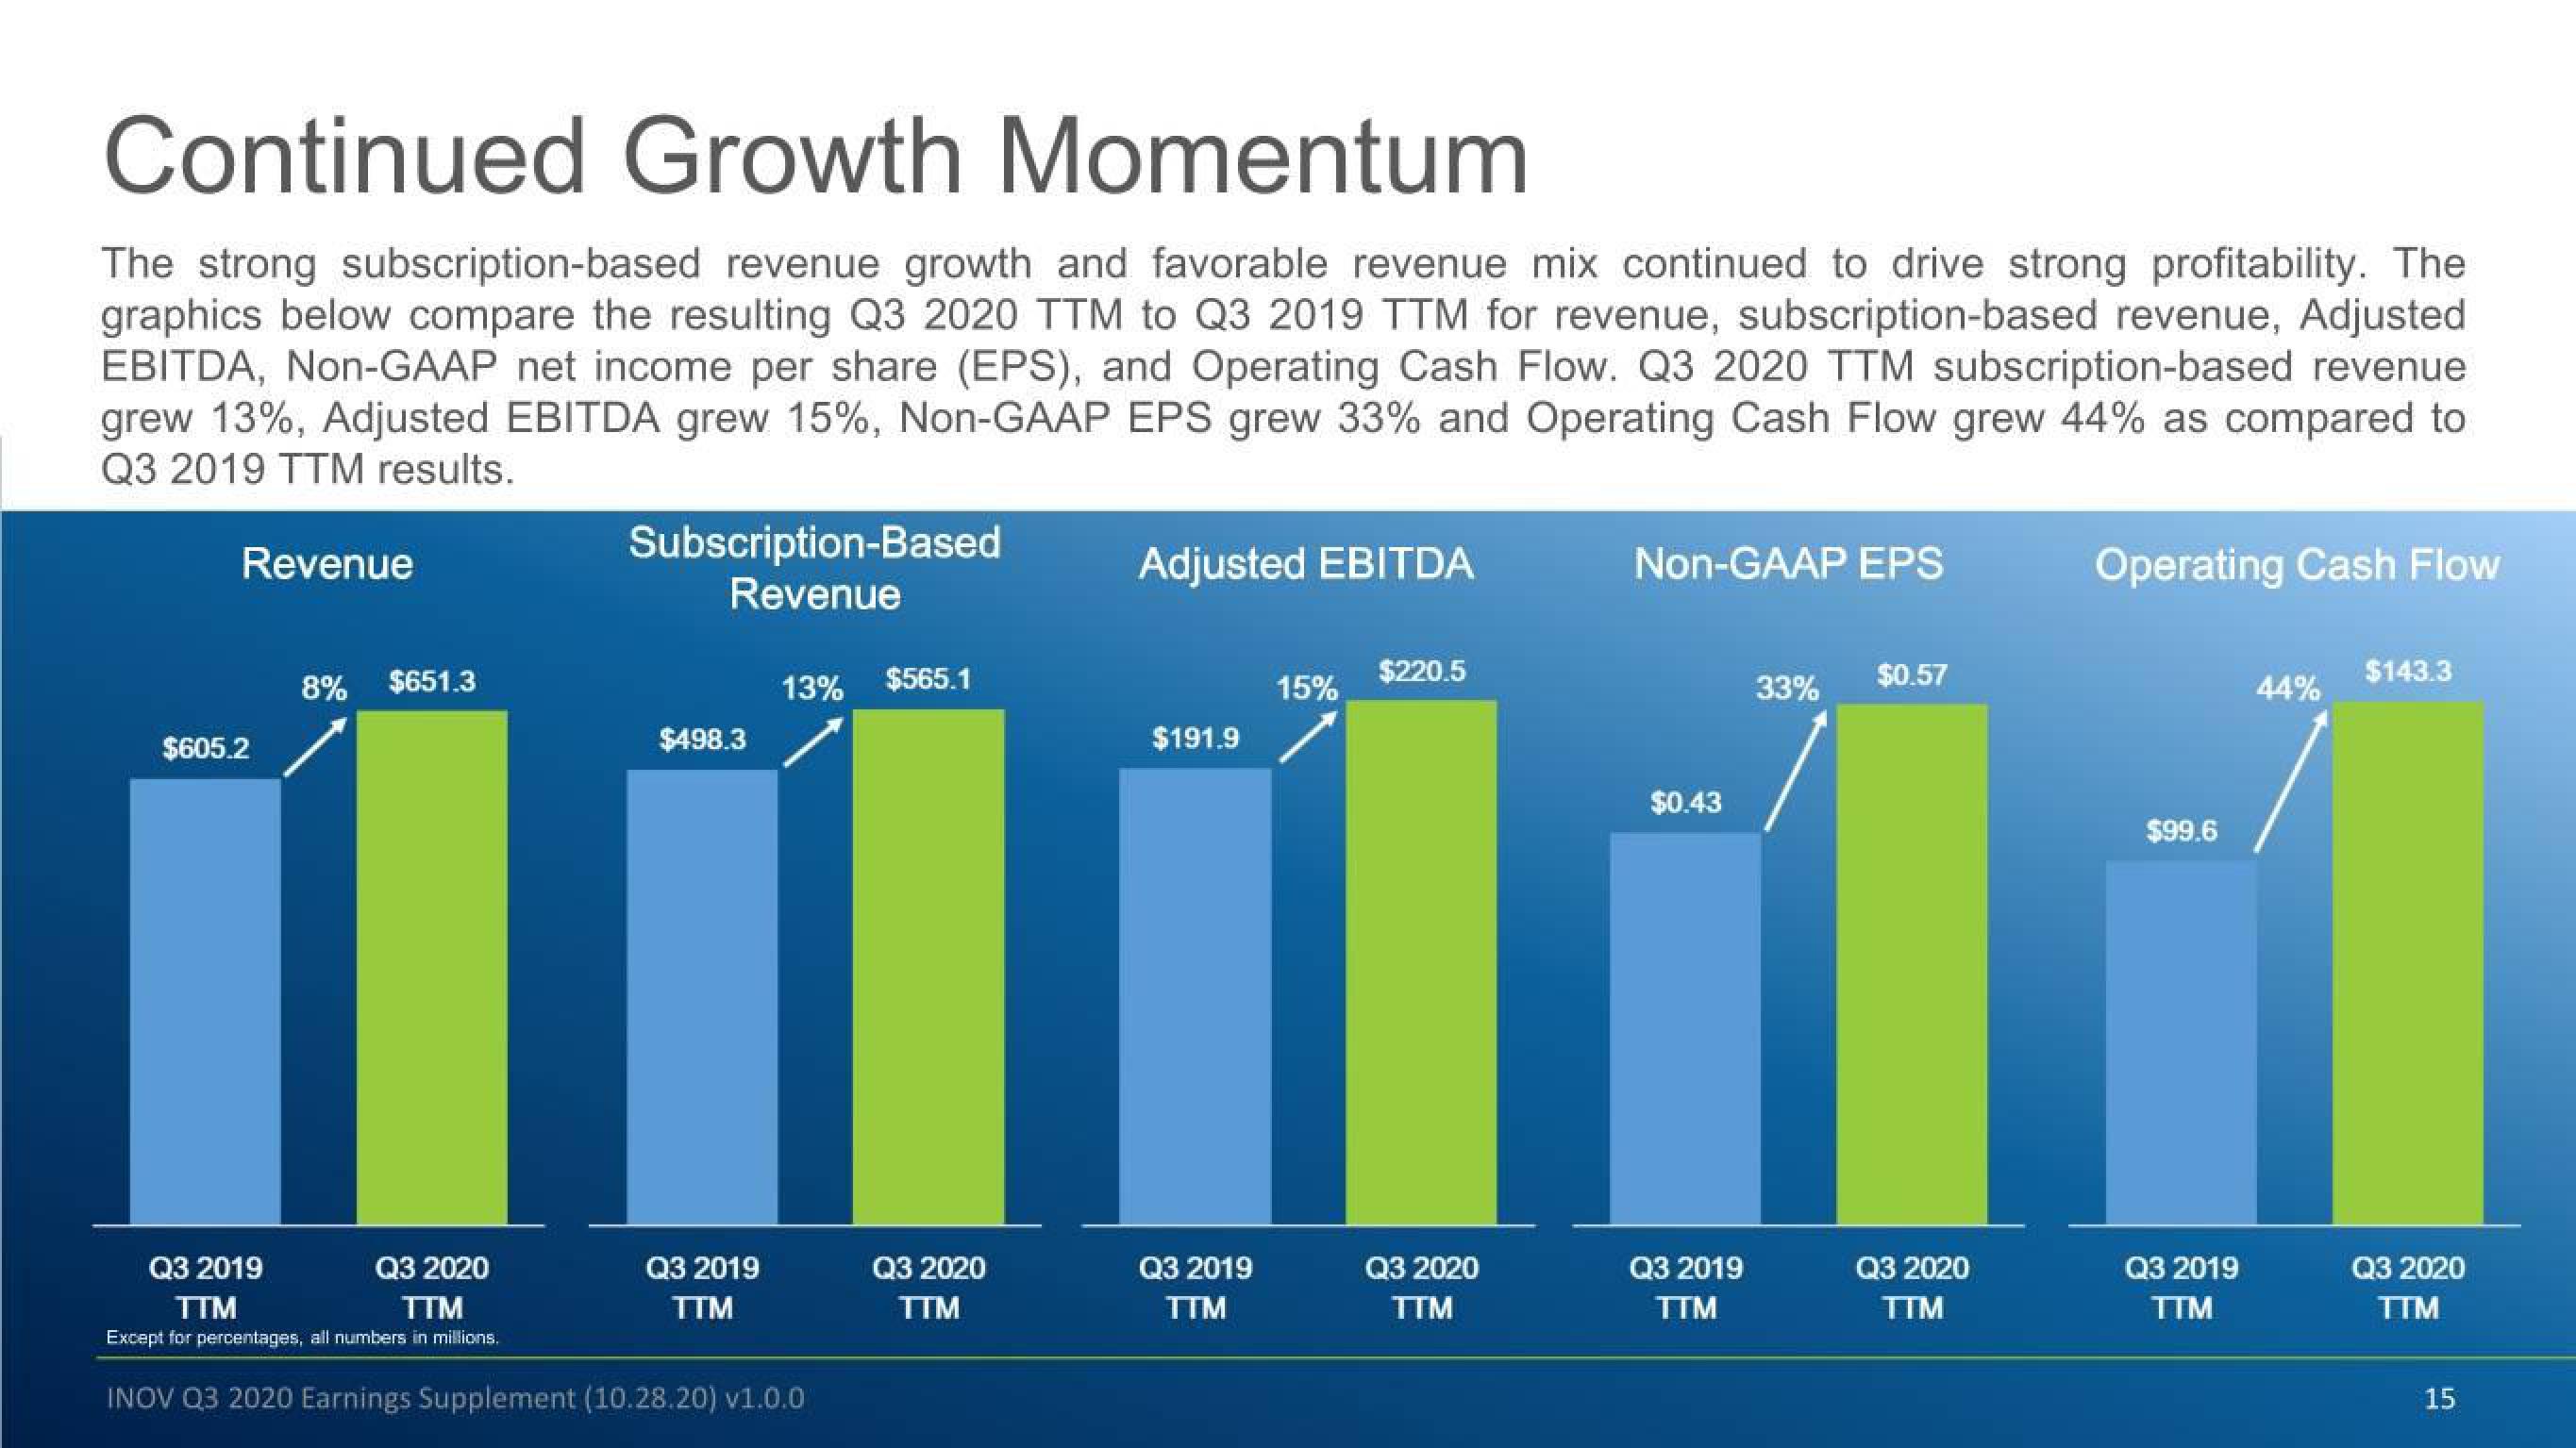
The strong subscription-based revenue growth and favorable revenue mix continued to drive strong profitability. The
graphics below compare the resulting Q3 2020 TTM to Q3 2019 TTM for revenue, subscription-based revenue, Adjusted
EBITDA, Non-GAAP net income per share (EPS), and Operating Cash Flow. Q3 2020 TTM subscription-based revenue
grew 13%, Adjusted EBITDA grew 15%, Non-GAAP EPS grew 33% and Operating Cash Flow grew 44% as compared to
Q3 2019 TTM results.
Revenue
$605.2
8% $651.3
Subscription-Based
Revenue
$498.3
13%
Q3 2019
Q3 2020
TTM
TTM
Except for percentages, all numbers in millions.
INOV Q3 2020 Earnings Supplement (10.28.20) v1.0.0
Q3 2019
TTM
$565.1
Q3 2020
TTM
Adjusted EBITDA
$191.9
Q3 2019
TTM
15%
$220.5
Q3 2020
TTM
Non-GAAP EPS
$0.43
Q3 2019
TTM
33%
$0.57
Q3 2020
TTM
Operating Cash Flow
$143.3
44%
$99.6
1
Q3 2019
TTM
Q3 2020
TTM
15View entire presentation