U.S. Wind to Hydrogen Modeling, Analysis, Testing, and Collaboration
Accomplishments:
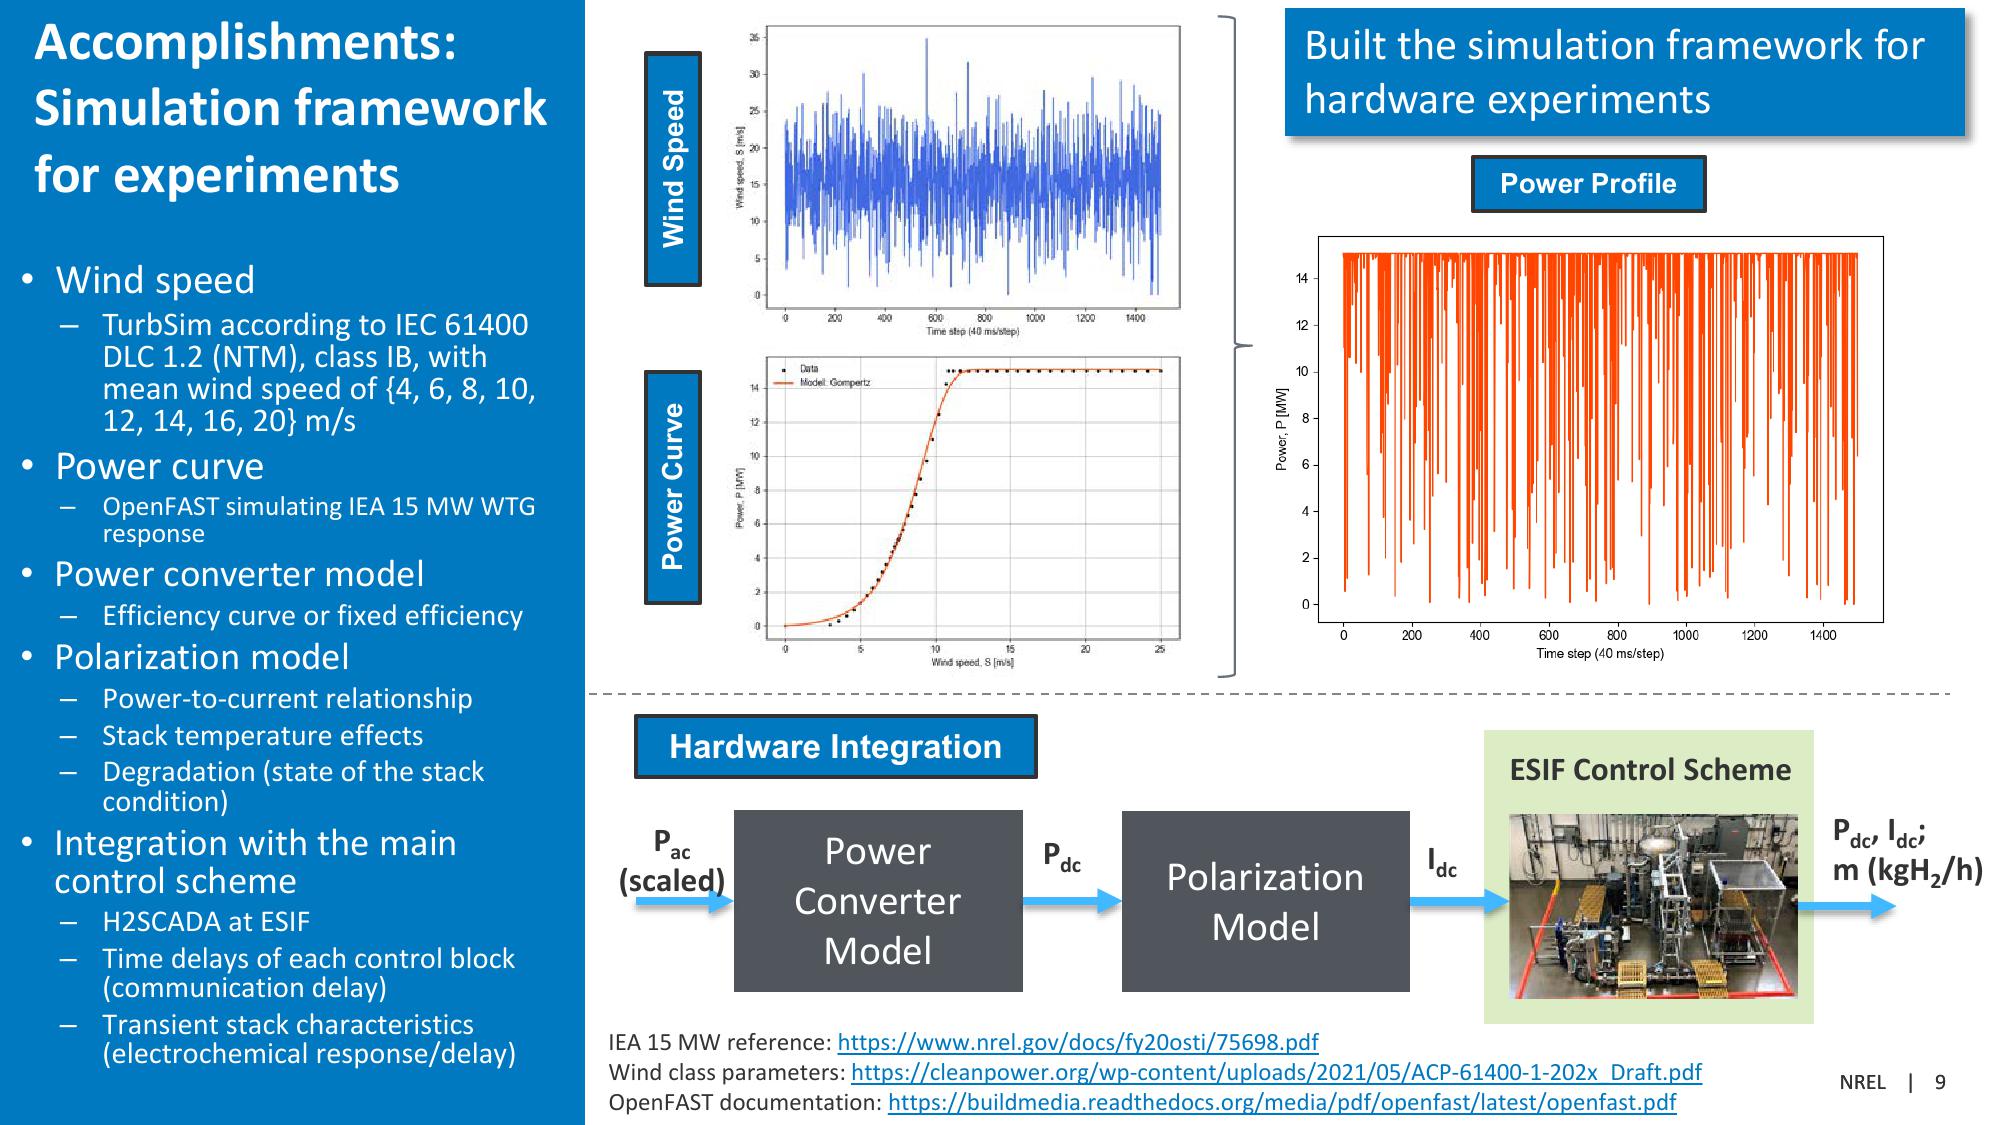
Simulation framework
for experiments
Wind speed
TurbSim according to IEC 61400
DLC 1.2 (NTM), class IB, with
mean wind speed of {4, 6, 8, 10,
12, 14, 16, 20} m/s
Power curve
OpenFAST simulating IEA 15 MW WTG
response
• Power converter model
•
•
Efficiency curve or fixed efficiency
Polarization model
Power-to-current relationship
Stack temperature effects
Degradation (state of the stack
condition)
Integration with the main
control scheme
H2SCADA at ESIF
Time delays of each control block
(communication delay)
Transient stack characteristics
(electrochemical response/delay)
Power Curve
Wind Speed
10
12
Wind speed. S [m/s]
30
0
0
200
400
600
800
1000
1200
1400
12
Time step (40 ms/step)
Data
14
Model Gompertz
10
15
20
Wind speed. S [m/s]
Hardware Integration
Power, P [MW]
60
4.
2-
10
14
Built the simulation framework for
hardware experiments
Power Profile
0-
200
400
600
800
1000
1200
1400
Time step (40 ms/step)
Idc
Pac
(scaled)
Power
Converter
Model
dc
Polarization
Model
ESIF Control Scheme
Pdc, Idci
m (kgH₂/h)
IEA 15 MW reference: https://www.nrel.gov/docs/fy20osti/75698.pdf
Wind class parameters: https://cleanpower.org/wp-content/uploads/2021/05/ACP-61400-1-202x Draft.pdf
OpenFAST documentation: https://buildmedia.readthedocs.org/media/pdf/openfast/latest/openfast.pdf
NREL 9View entire presentation