Spring 2023 Solar Industry Update
U.S. Electric Capacity Additions (GWdc)
New U.S. Capacity Additions,
2012-2022
■Natural gas Other Nuclear Wind Batteries CSP DPV UPV
45
40
35
30
212242
25
20
15
10
5
0
2012 2013 2014 2015 2016 2017 2018 2019 2020 2021 2022
.
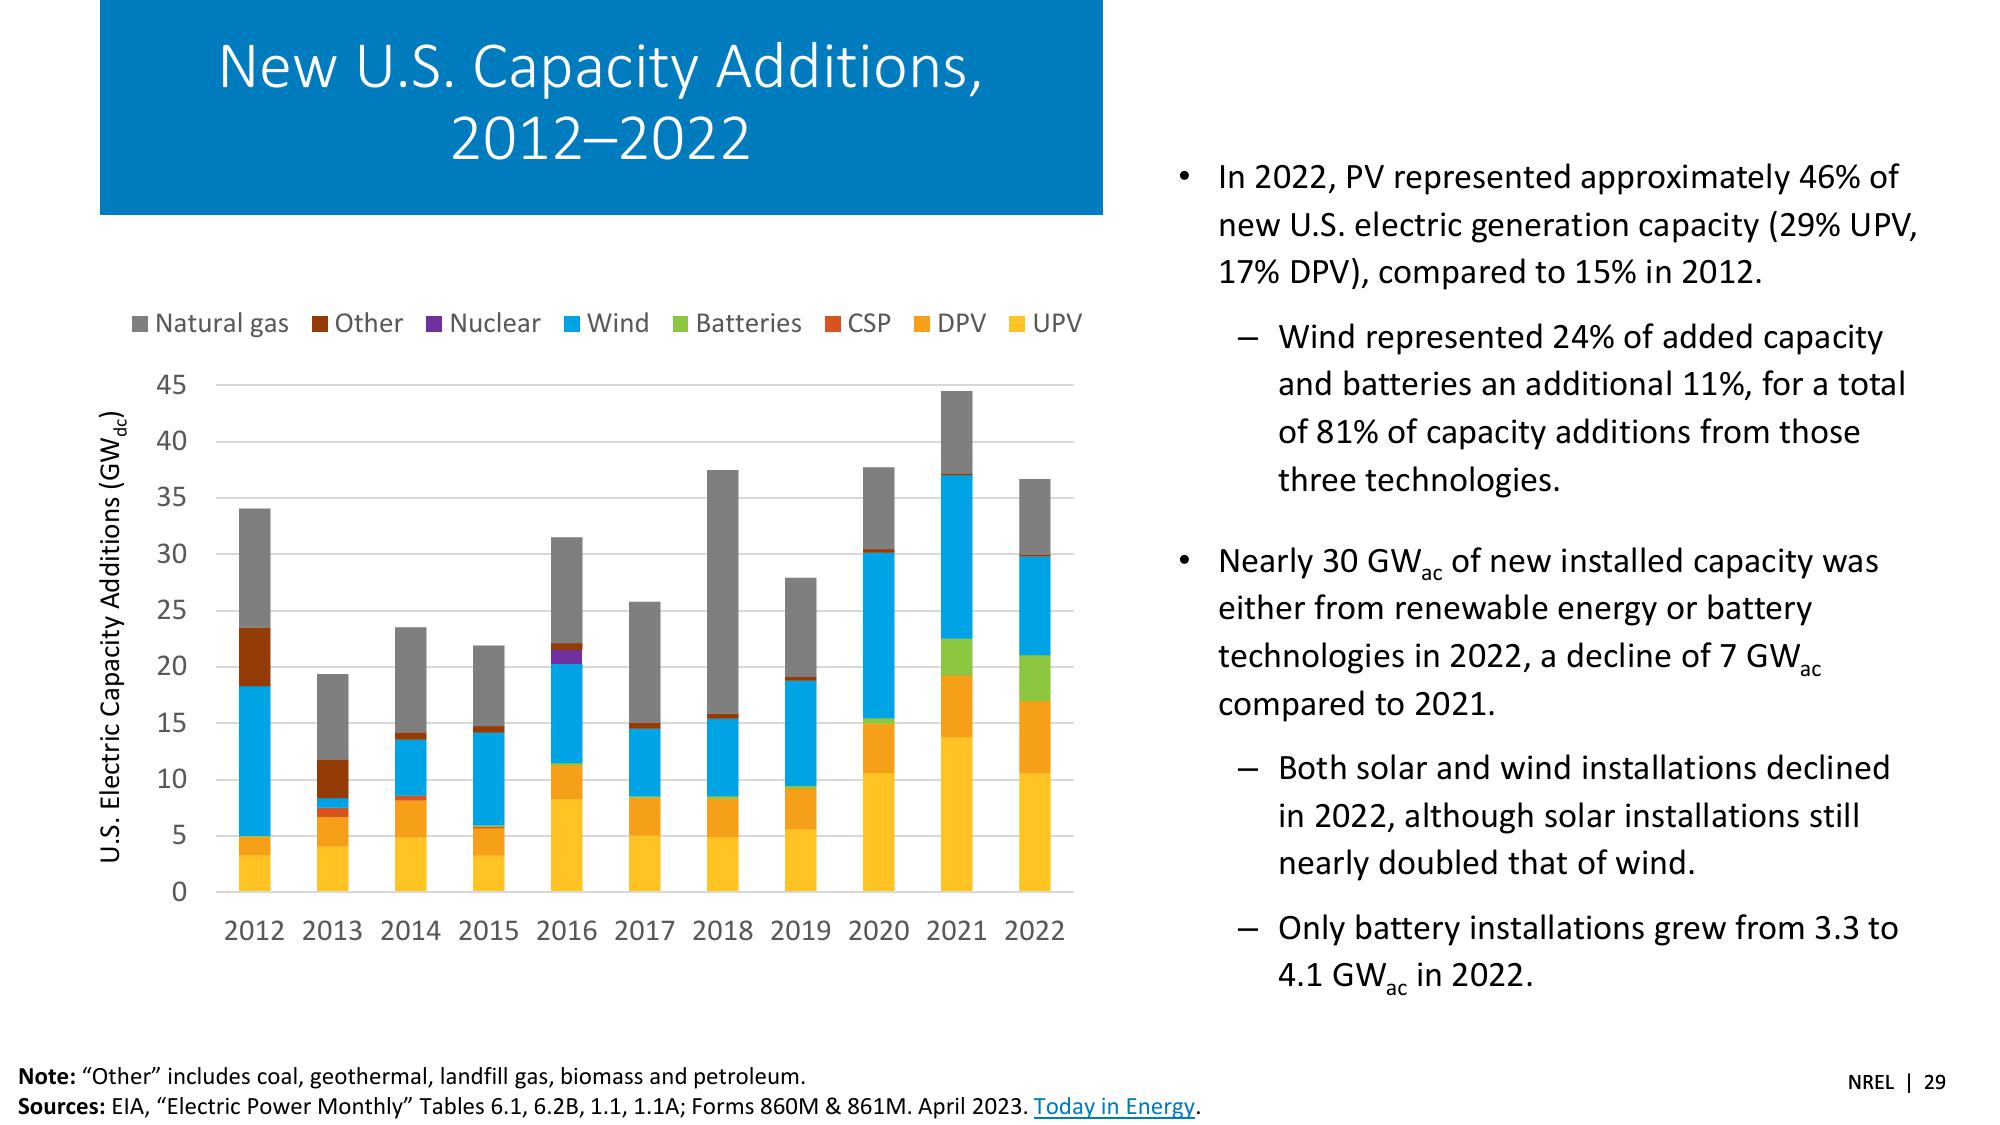
In 2022, PV represented approximately 46% of
new U.S. electric generation capacity (29% UPV,
17% DPV), compared to 15% in 2012.
-
Wind represented 24% of added capacity
and batteries an additional 11%, for a total
of 81% of capacity additions from those
three technologies.
Nearly 30 GWac of new installed capacity was
either from renewable energy or battery
technologies in 2022, a decline of 7 GWa
compared to 2021.
ас
Both solar and wind installations declined
in 2022, although solar installations still
nearly doubled that of wind.
Only battery installations grew from 3.3 to
4.1 GW in 2022.
ас
Note: "Other" includes coal, geothermal, landfill gas, biomass and petroleum.
Sources: EIA, "Electric Power Monthly" Tables 6.1, 6.2B, 1.1, 1.1A; Forms 860M & 861M. April 2023. Today in Energy.
NREL 29View entire presentation