Cboe Results Presentation Deck
Non-GAAP Information
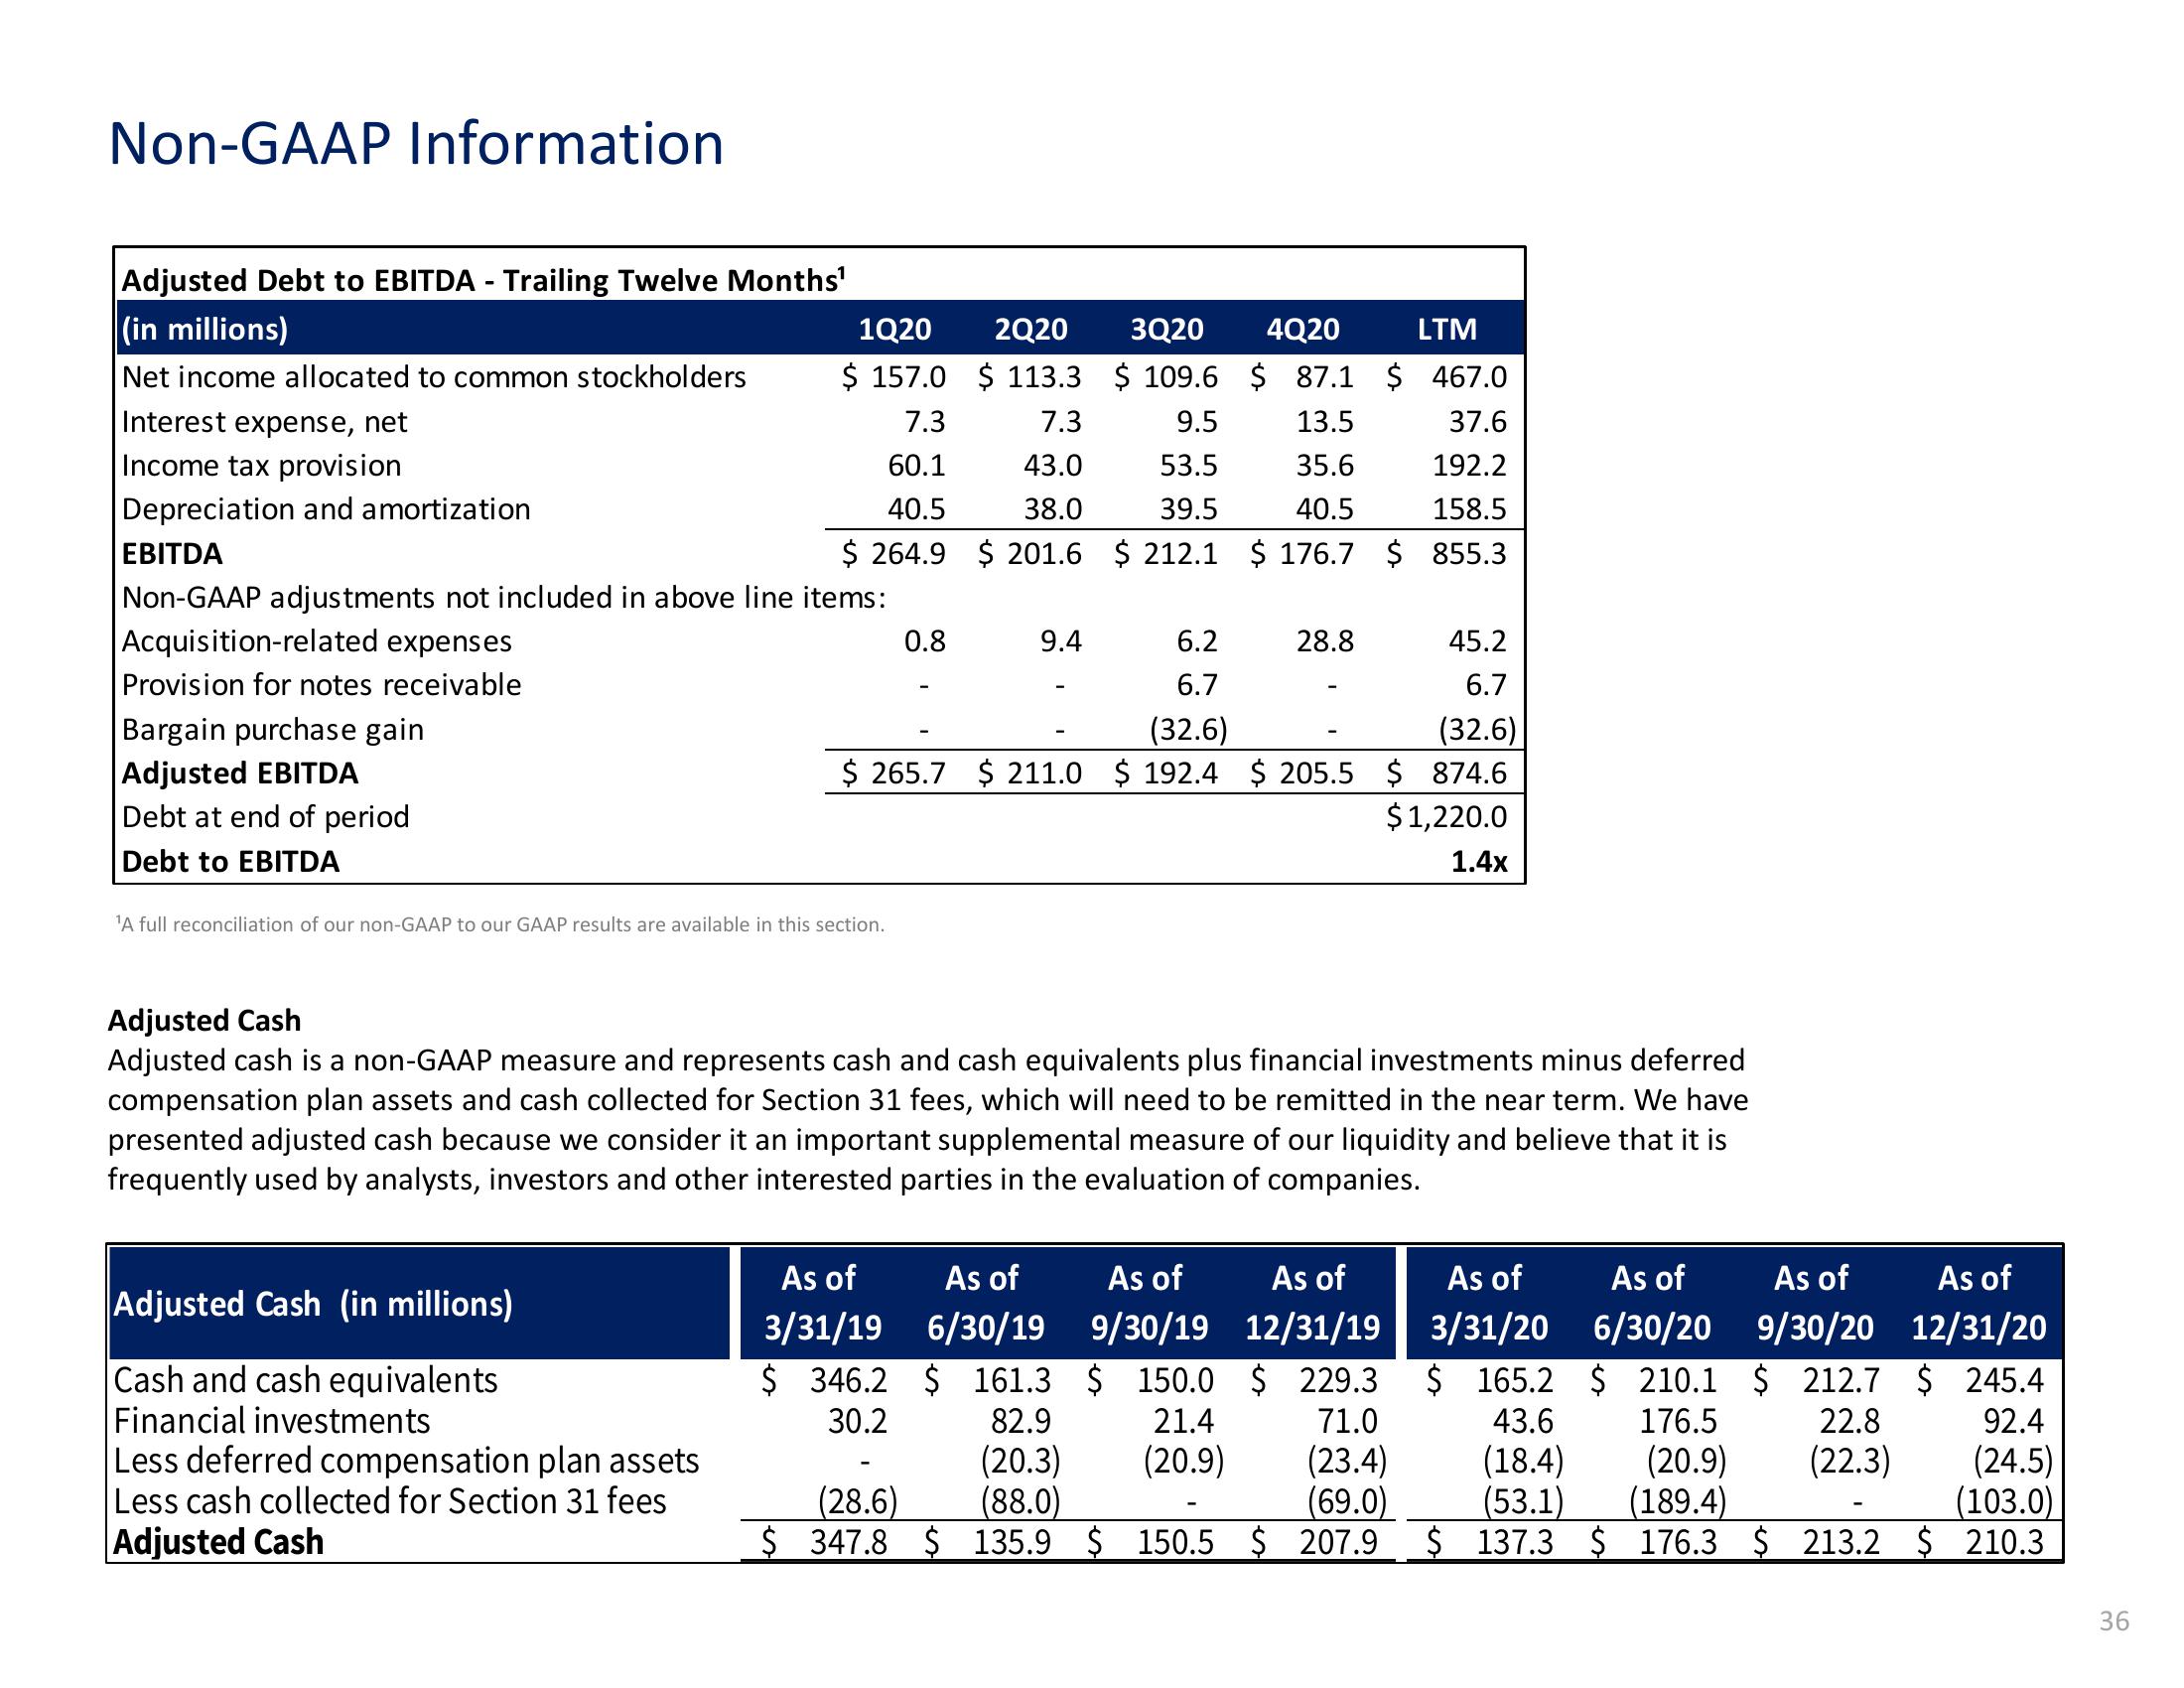
Adjusted Debt to EBITDA - Trailing Twelve Months¹
(in millions)
Net income allocated to common stockholders
1Q20
$ 157.0
7.3
60.1
40.5
EBITDA
$ 264.9
Non-GAAP adjustments not included in above line items:
Acquisition-related expenses
Provision for notes receivable
Interest expense, net
Income tax provision
Depreciation and amortization
Bargain purchase gain
Adjusted EBITDA
Debt at end of period
Debt to EBITDA
¹A full reconciliation of our non-GAAP to our GAAP results are available in this section.
6.2
45.2
6.7
6.7
(32.6)
(32.6)
$265.7 $211.0 $ 192.4 $205.5 $ 874.6
$1,220.0
1.4x
Adjusted Cash (in millions)
Cash and cash equivalents
Financial investments
Less deferred compensation plan assets
Less cash collected for Section 31 fees
Adjusted Cash
2Q20 3Q20 4Q20
LTM
$ 113.3
$ 109.6 $ 87.1 $ 467.0
7.3
9.5
13.5
37.6
43.0
53.5
35.6
192.2
39.5
40.5
158.5
38.0
$201.6 $ 212.1 $ 176.7 $ 855.3
0.8
9.4
28.8
Adjusted Cash
Adjusted cash is a non-GAAP measure and represents cash and cash equivalents plus financial investments minus deferred
compensation plan assets and cash collected for Section 31 fees, which will need to be remitted in the near term. We have
presented adjusted cash because we consider it an important supplemental measure of our liquidity and believe that it is
frequently used by analysts, investors and other interested parties in the evaluation of companies.
As of
3/31/19
As of As
As of
6/30/19 9/30/19 12/31/19
$ 346.2 $ 161.3 $ 150.0 $ 229.3
30.2
82.9
21.4
71.0
(20.3)
(20.9)
(23.4)
(28.6)
(88.0)
(69.0)
$347.8 $ 135.9 $ 150.5 $ 207.9
As of
3/31/20
$ 165.2 $ 210.1
43.6
(18.4)
(53.1)
$ 137.3
As of
12/31/20
$ 212.7 $ 245.4
176.5
22.8
92.4
(20.9) (22.3) (24.5)
(103.0)
(189.4)
$ 176.3 $ 213.2 $ 210.3
As of As of
6/30/20 9/30/20
36View entire presentation