Origin SPAC Presentation Deck
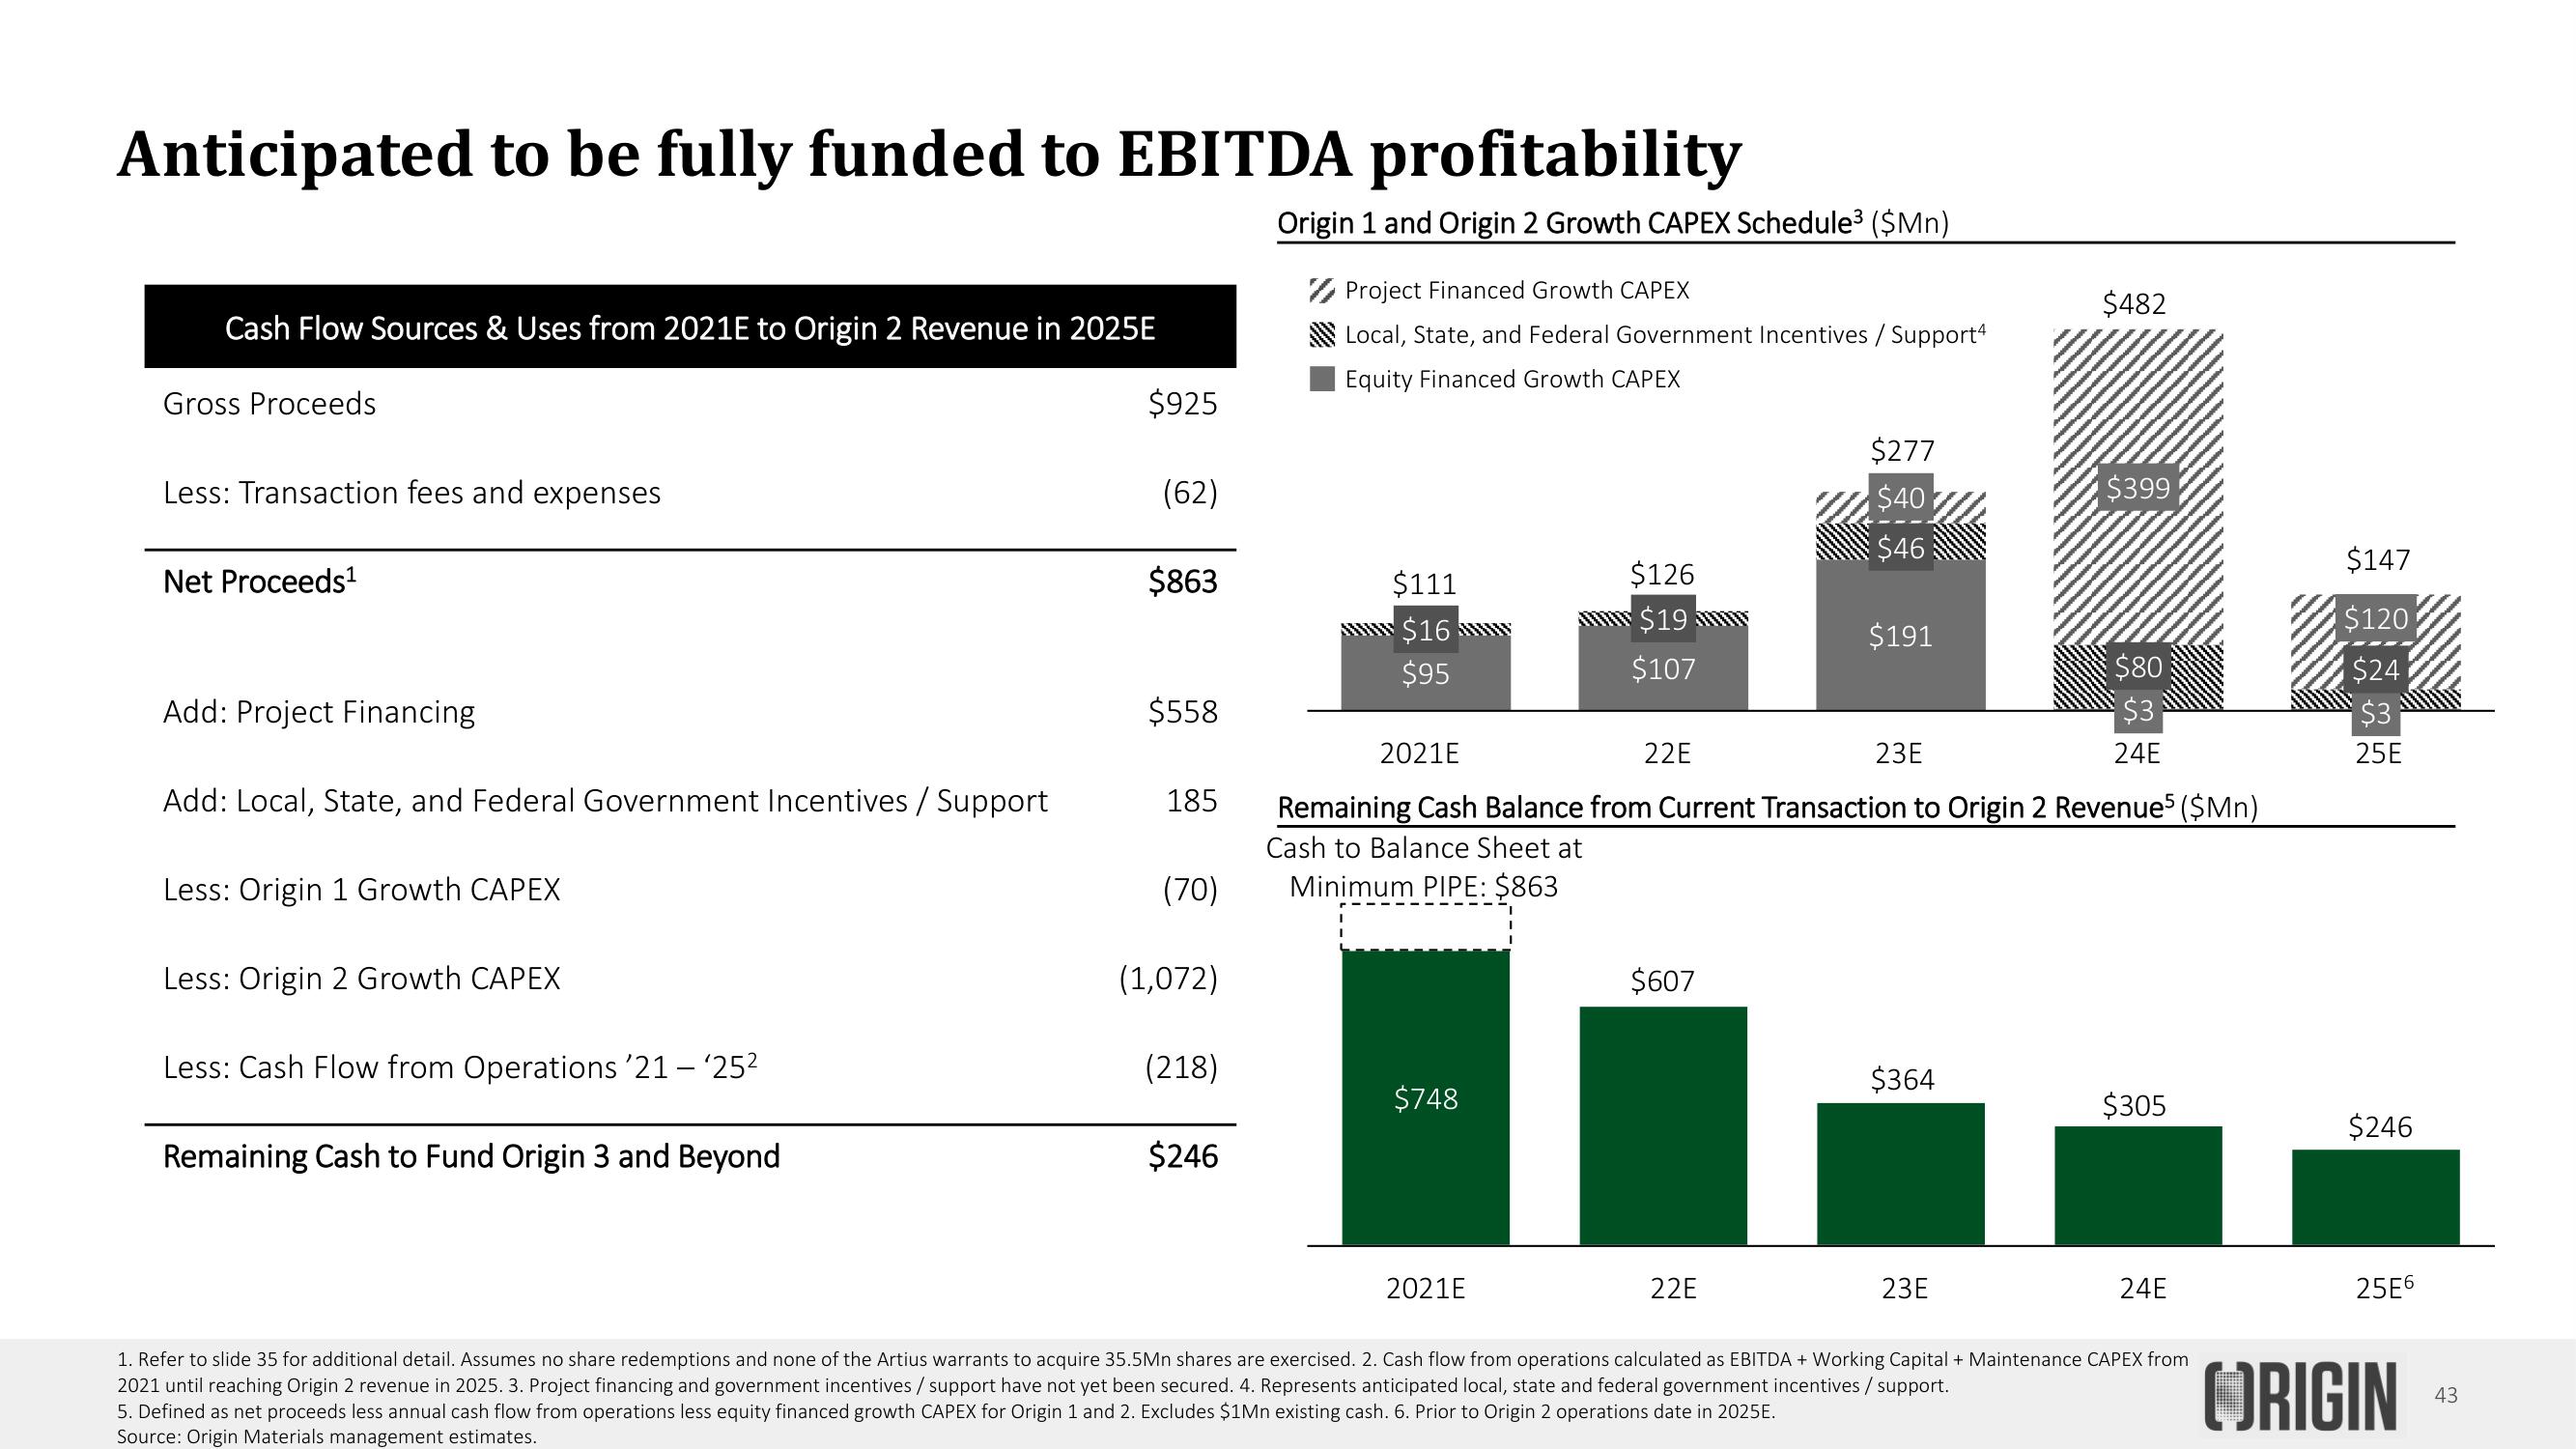
Anticipated to be fully funded to EBITDA profitability
Cash Flow Sources & Uses from 2021E to Origin 2 Revenue in 2025E
Gross Proceeds
Less: Transaction fees and expenses
Net Proceeds¹
Add: Project Financing
Add: Local, State, and Federal Government Incentives / Support
Less: Origin 1 Growth CAPEX
Less: Origin 2 Growth CAPEX
Less: Cash Flow from Operations '21 - '25²
Remaining Cash to Fund Origin 3 and Beyond
$925
(62)
$863
$558
185
(70)
(1,072)
(218)
$246
Origin 1 and Origin 2 Growth CAPEX Schedule³ ($Mn)
Project Financed Growth CAPEX
Local, State, and Federal Government Incentives / Support4
Equity Financed Growth CAPEX
$111
$16
$95
$748
$126
$19
$107
2021E
22E
$607
$277
$40
$46
2021E
23E
Remaining Cash Balance from Current Transaction to Origin 2 Revenue5 ($Mn)
Cash to Balance Sheet at
Minimum PIPE: $863
22E
$191
$364
$482
23E
$399
$80
$3
24E
$305
24E
1. Refer to slide 35 for additional detail. Assumes no share redemptions and none of the Artius warrants to acquire 35.5Mn shares are exercised. 2. Cash flow from operations calculated as EBITDA + Working Capital + Maintenance CAPEX from
2021 until reaching Origin 2 revenue in 2025. 3. Project financing and government incentives / support have not yet been secured. 4. Represents anticipated local, state and federal government incentives / support.
5. Defined as net proceeds less annual cash flow from operations less equity financed growth CAPEX for Origin 1 and 2. Excludes $1Mn existing cash. 6. Prior to Origin 2 operations date in 2025E.
Source: Origin Materials management estimates.
$147
$120
$24
$3
25E
$246
25E6
ORIGIN
43View entire presentation