Jefferies Financial Group Investor Day Presentation Deck slide image

Jefferies Financial Group Investor Day Presentation Deck

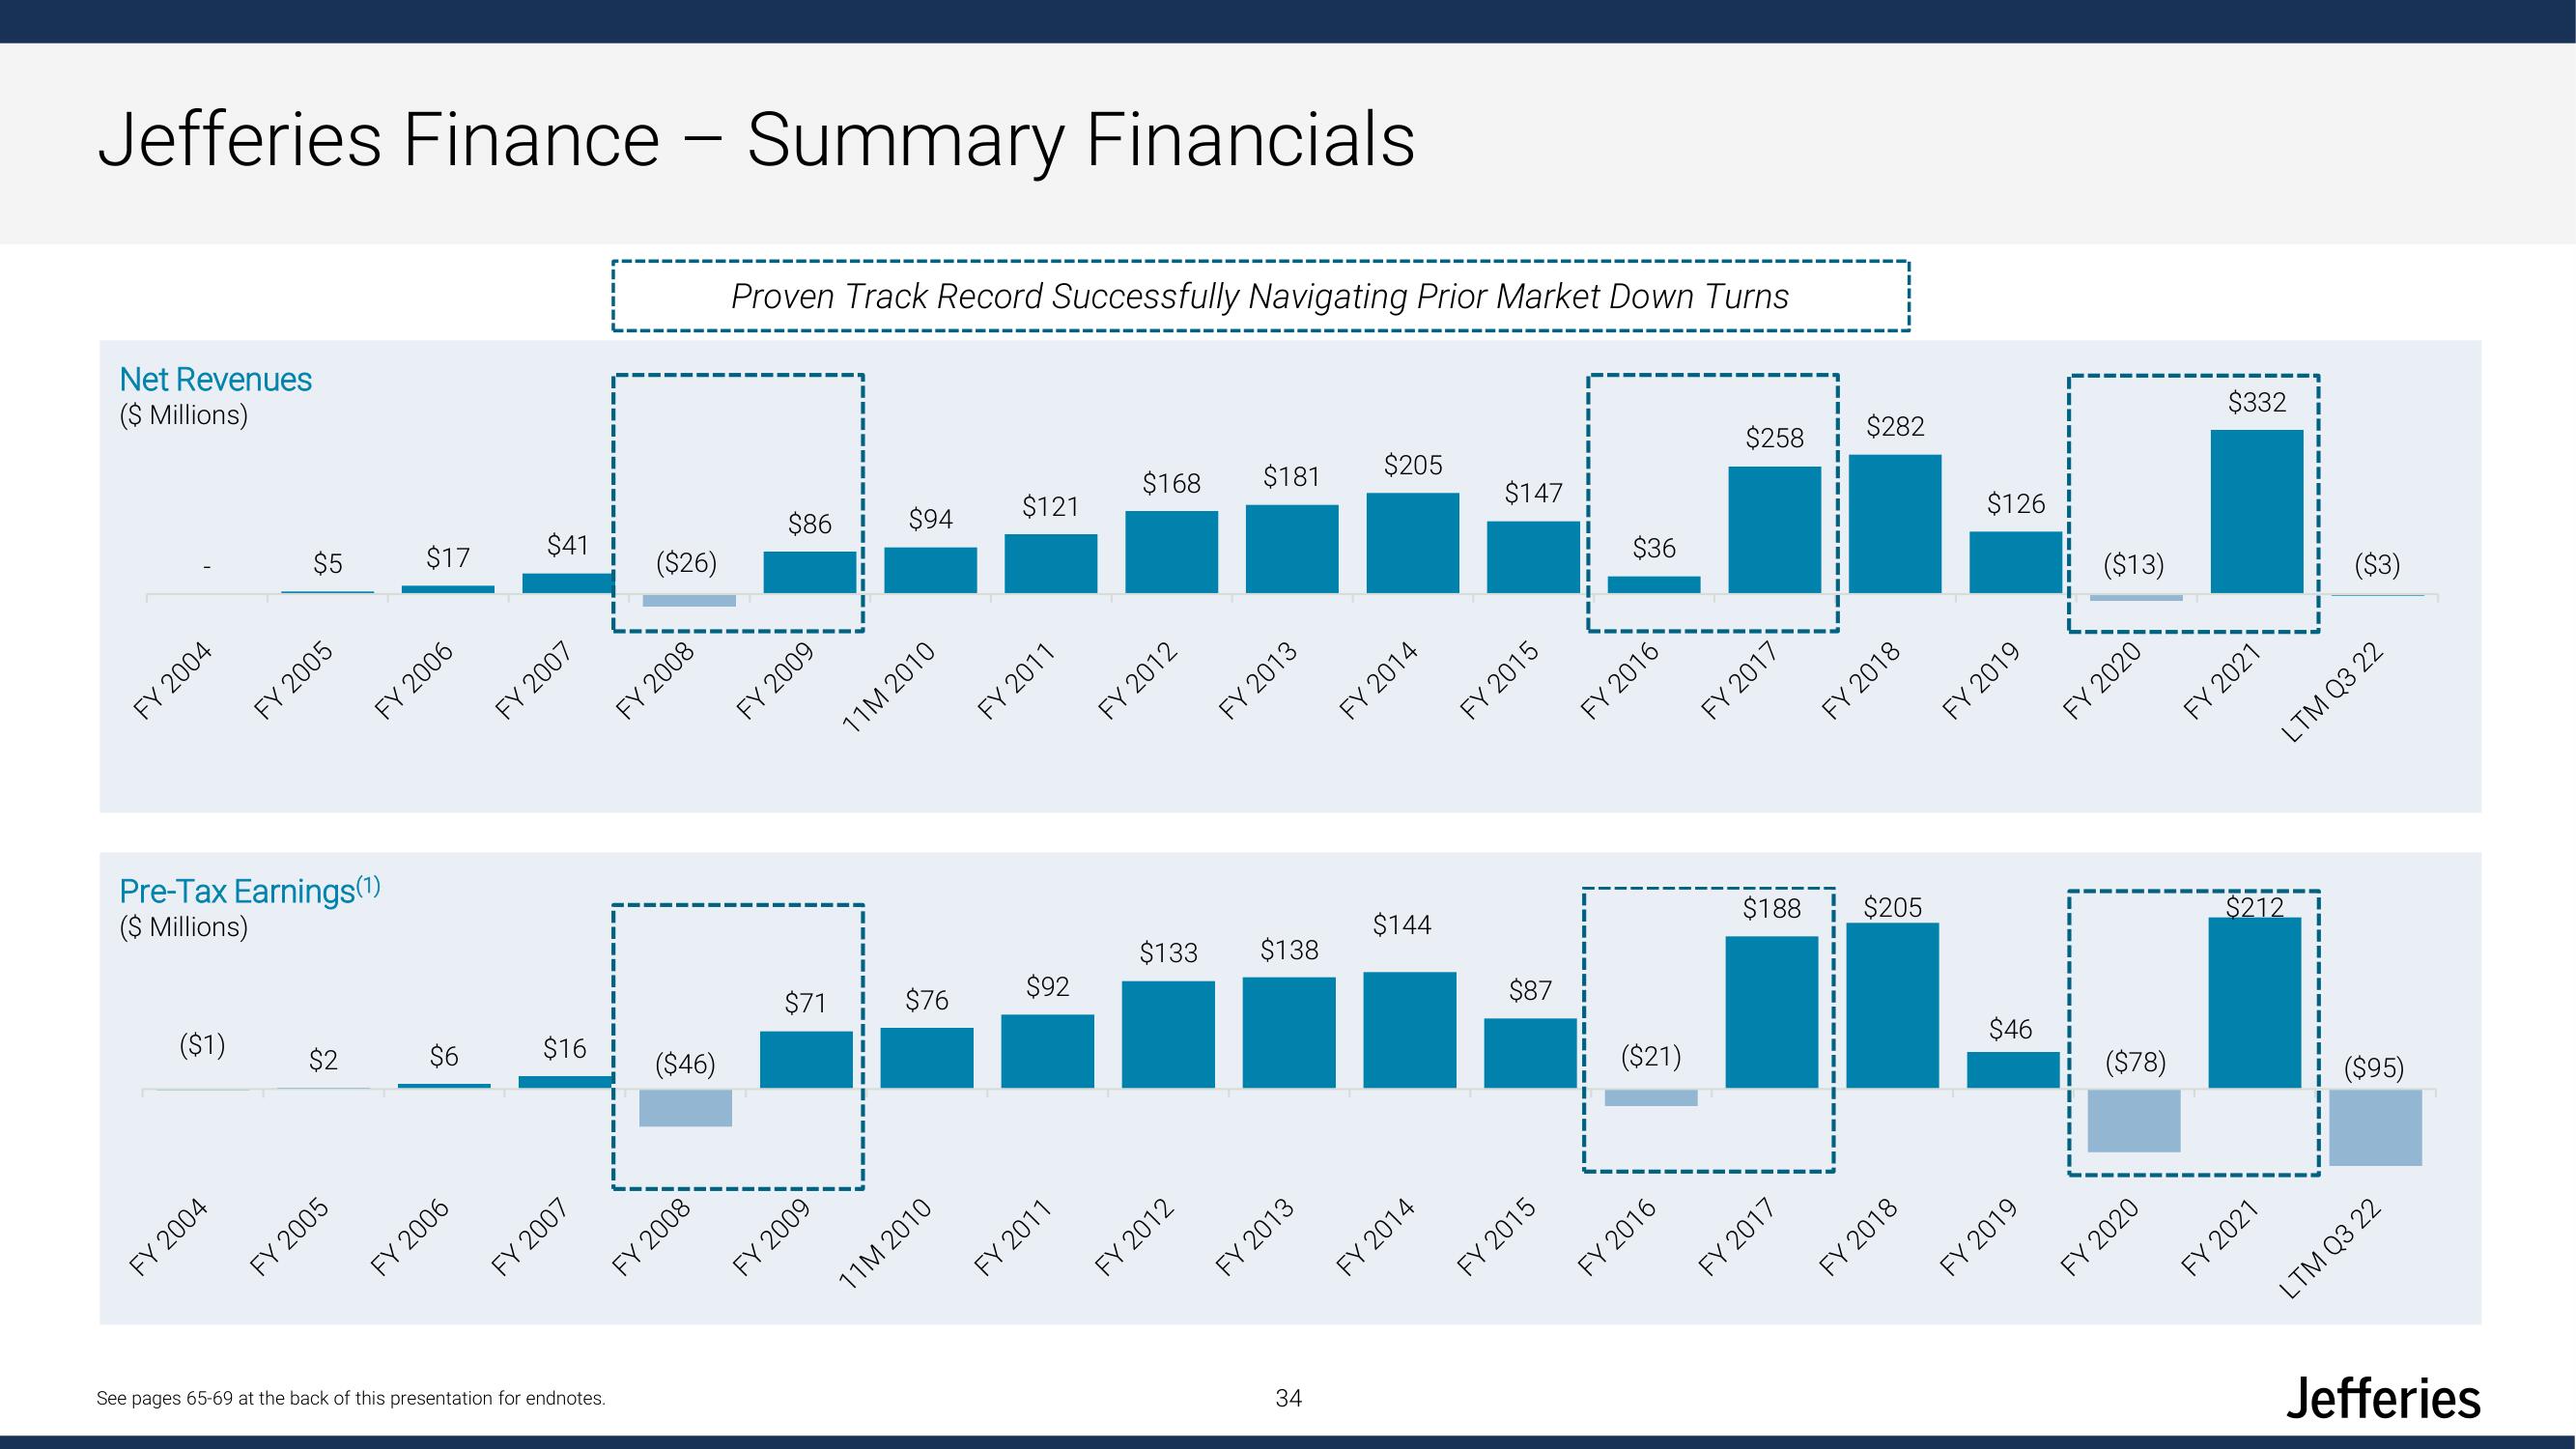
Jefferies Finance Summary Financials. Net Revenues ($ Millions) FY 2004 ($1) $5 Pre-Tax Earnings (1) ($ Millions) FY 2004 FY 2005 $2 FY 2005 $17 $41 FY 2006 $6 FY 2006 FY 2007 $16 FY 2007 See pages 65-69 at the back of this presentation for endnotes. - ($26) FY 2008 ($46) FY 2008 Proven Track Record Successfully Navigating Prior Market Down Turns $86 FY 2009 $71 FY 2009 $94 11M 2010 $76 11M 2010 $121 FY 2011 $92 FY 2011 $168 $181 FY 2012 $133 FY 2012 FY 2013 $138 FY 2013 34 $205 FY 2014 $144 FY 2014 $147 FY 2015 $87 FY 2015 $36 FY 2016 1 ($21) FY 2016 $258 FY 2017 $282 FY 2017 FY 2018 $188 $205 FY 2018 $126 FY 2019 $46 FY 2019 I 1 ($13) FY 2020 ($78) FY 2020 $332 FY 2021 LTM Q3 22 $212 FY 2021 ($95) LTM Q3 22 Jefferies
View entire presentation