Carlyle Investor Conference Presentation Deck
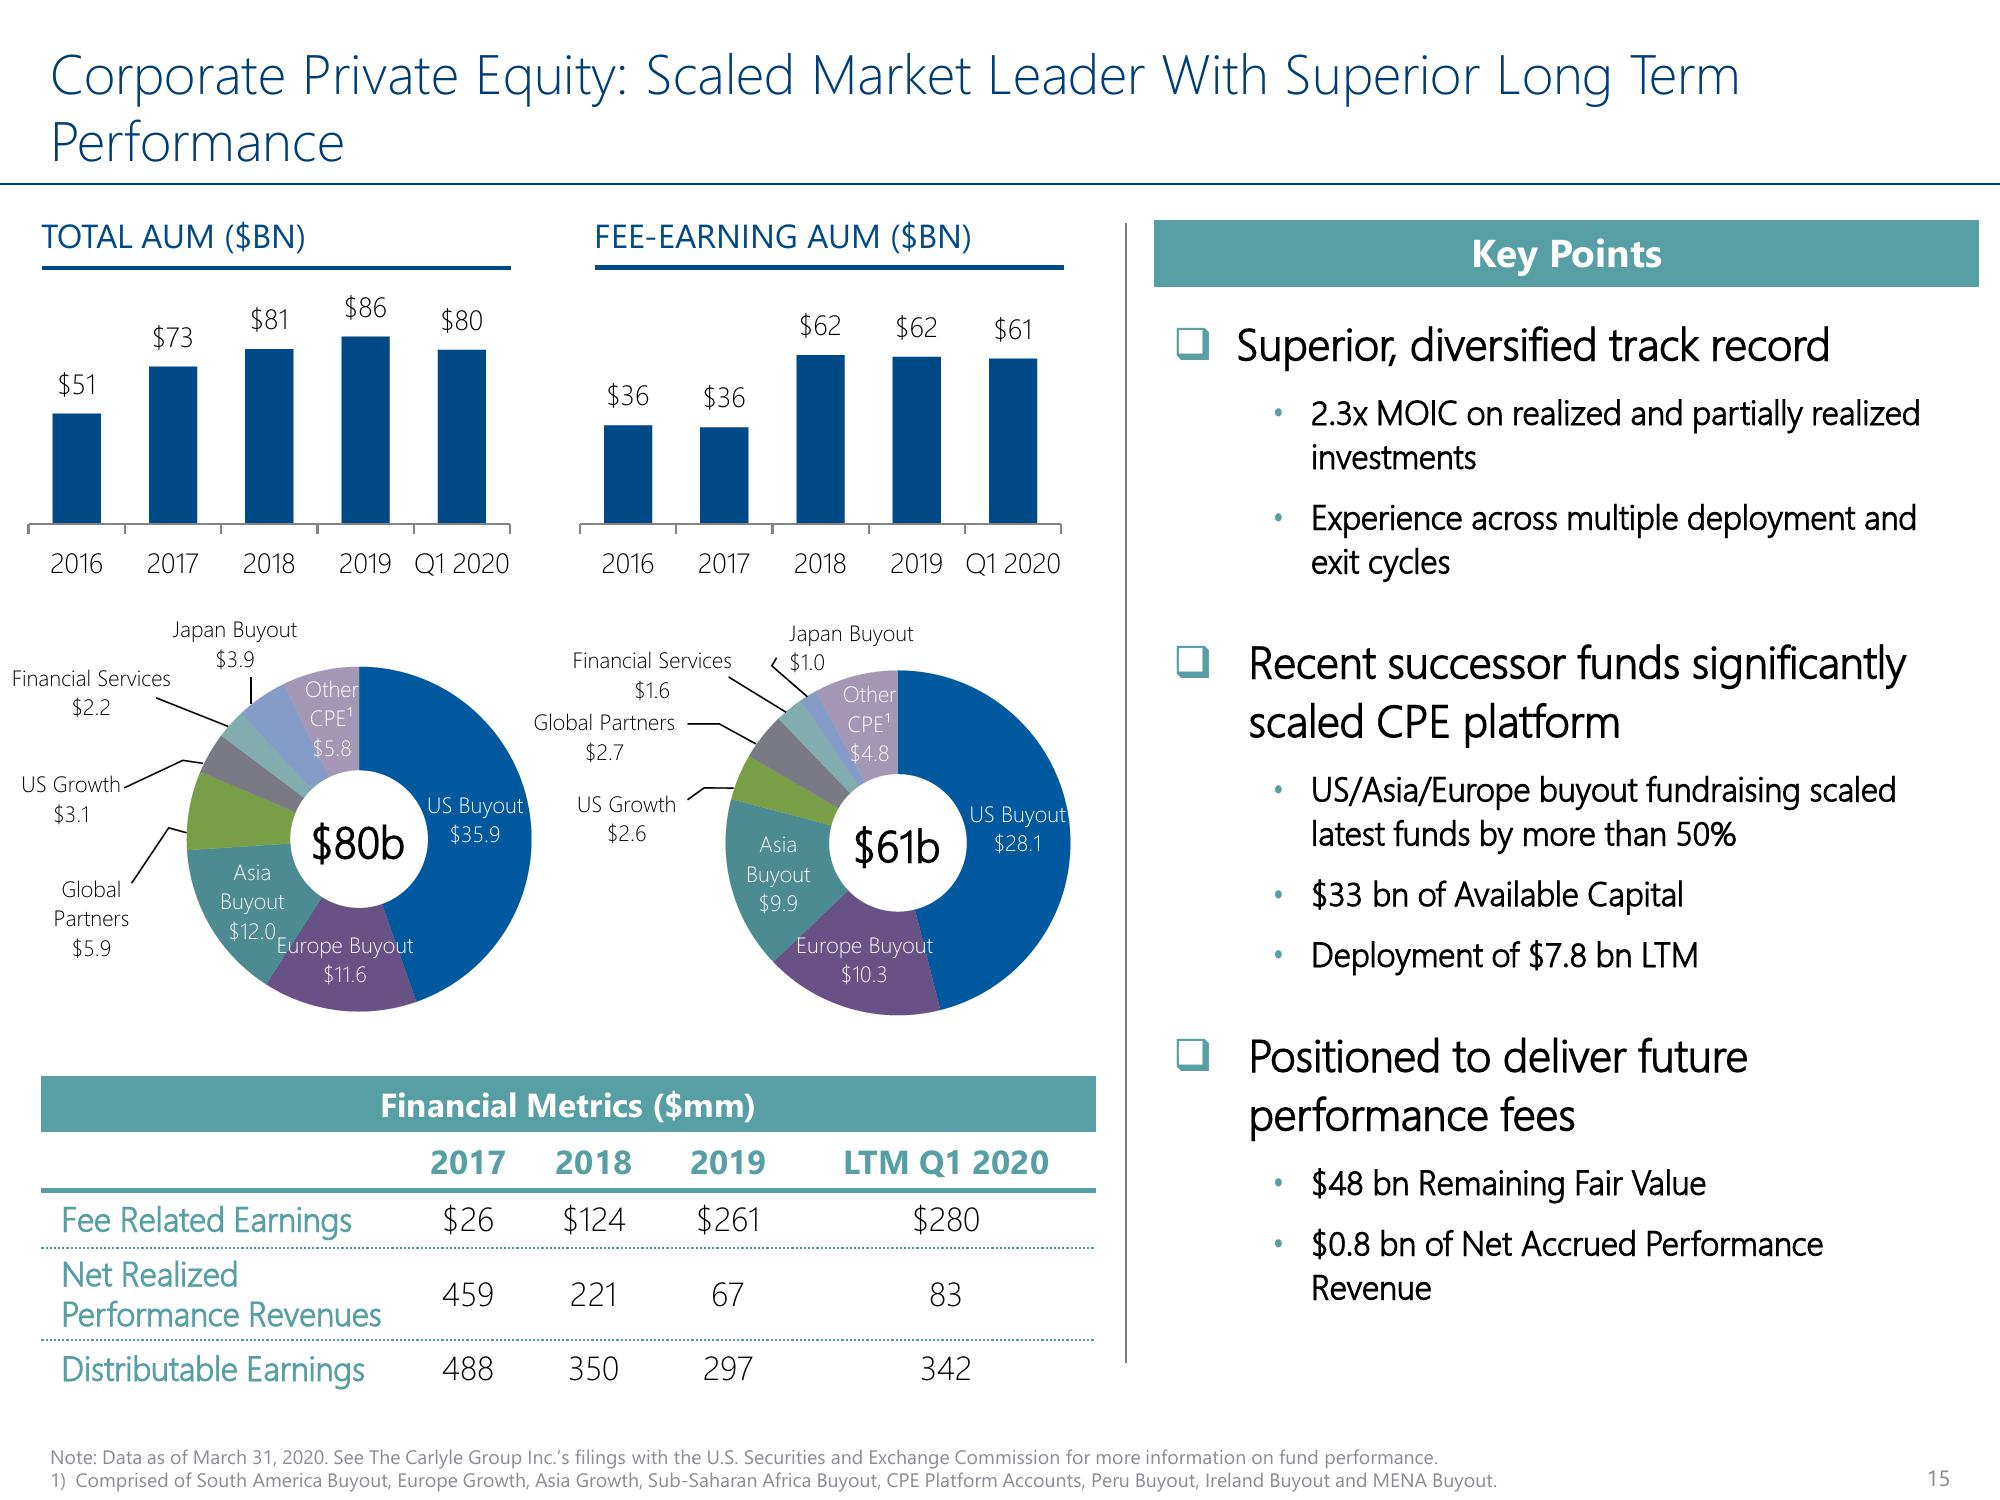
Corporate Private Equity: Scaled Market Leader With Superior Long Term
Performance
TOTAL AUM ($BN)
$73
US Growth.
$3.1
$51
1
2016 2017 2018 2019 Q1 2020
Financial Services
$2.2
Global
Partners
$5.9
$86
$81
Japan Buyout
$3.9
Asia
Buyout
$12.0,
Other
CPE¹
$5.8
$80b
Europe Buyout
$11.6
$80
Fee Related Earnings
Net Realized
Performance Revenues
Distributable Earnings
US Buyout
$35.9
459
FEE-EARNING AUM ($BN)
488
$36 $36
2016 2017
Financial Services
$1.6
Global Partners
$2.7
Financial Metrics ($mm)
2017 2018 2019
$26
$124
$261
US Growth
$2.6
221
350
67
$62
297
2018 2019 Q1 2020
Asia
Buyout
$9.9
$62 $61
Japan Buyout
< $1.0
Other
CPE1
$4.8
$61b
Europe Buyout
$10.3
US Buyout
$28.1
LTM Q1 2020
$280
83
342
Key Points
Superior, diversified track record
●
2.3x MOIC on realized and partially realized
investments
Recent successor funds significantly
scaled CPE platform
●
Experience across multiple deployment and
exit cycles
·
Positioned to deliver future
performance fees
US/Asia/Europe buyout fundraising scaled
latest funds by more than 50%
$33 bn of Available Capital
Deployment of $7.8 bn LTM
$48 bn Remaining Fair Value
$0.8 bn of Net Accrued Performance
Revenue
Note: Data as of March 31, 2020. See The Carlyle Group Inc.'s filings with the U.S. Securities and Exchange Commission for more information on fund performance.
1) Comprised of South America Buyout, Europe Growth, Asia Growth, Sub-Saharan Africa Buyout, CPE Platform Accounts, Peru Buyout, Ireland Buyout and MENA Buyout.
15View entire presentation