Overstock Results Presentation Deck
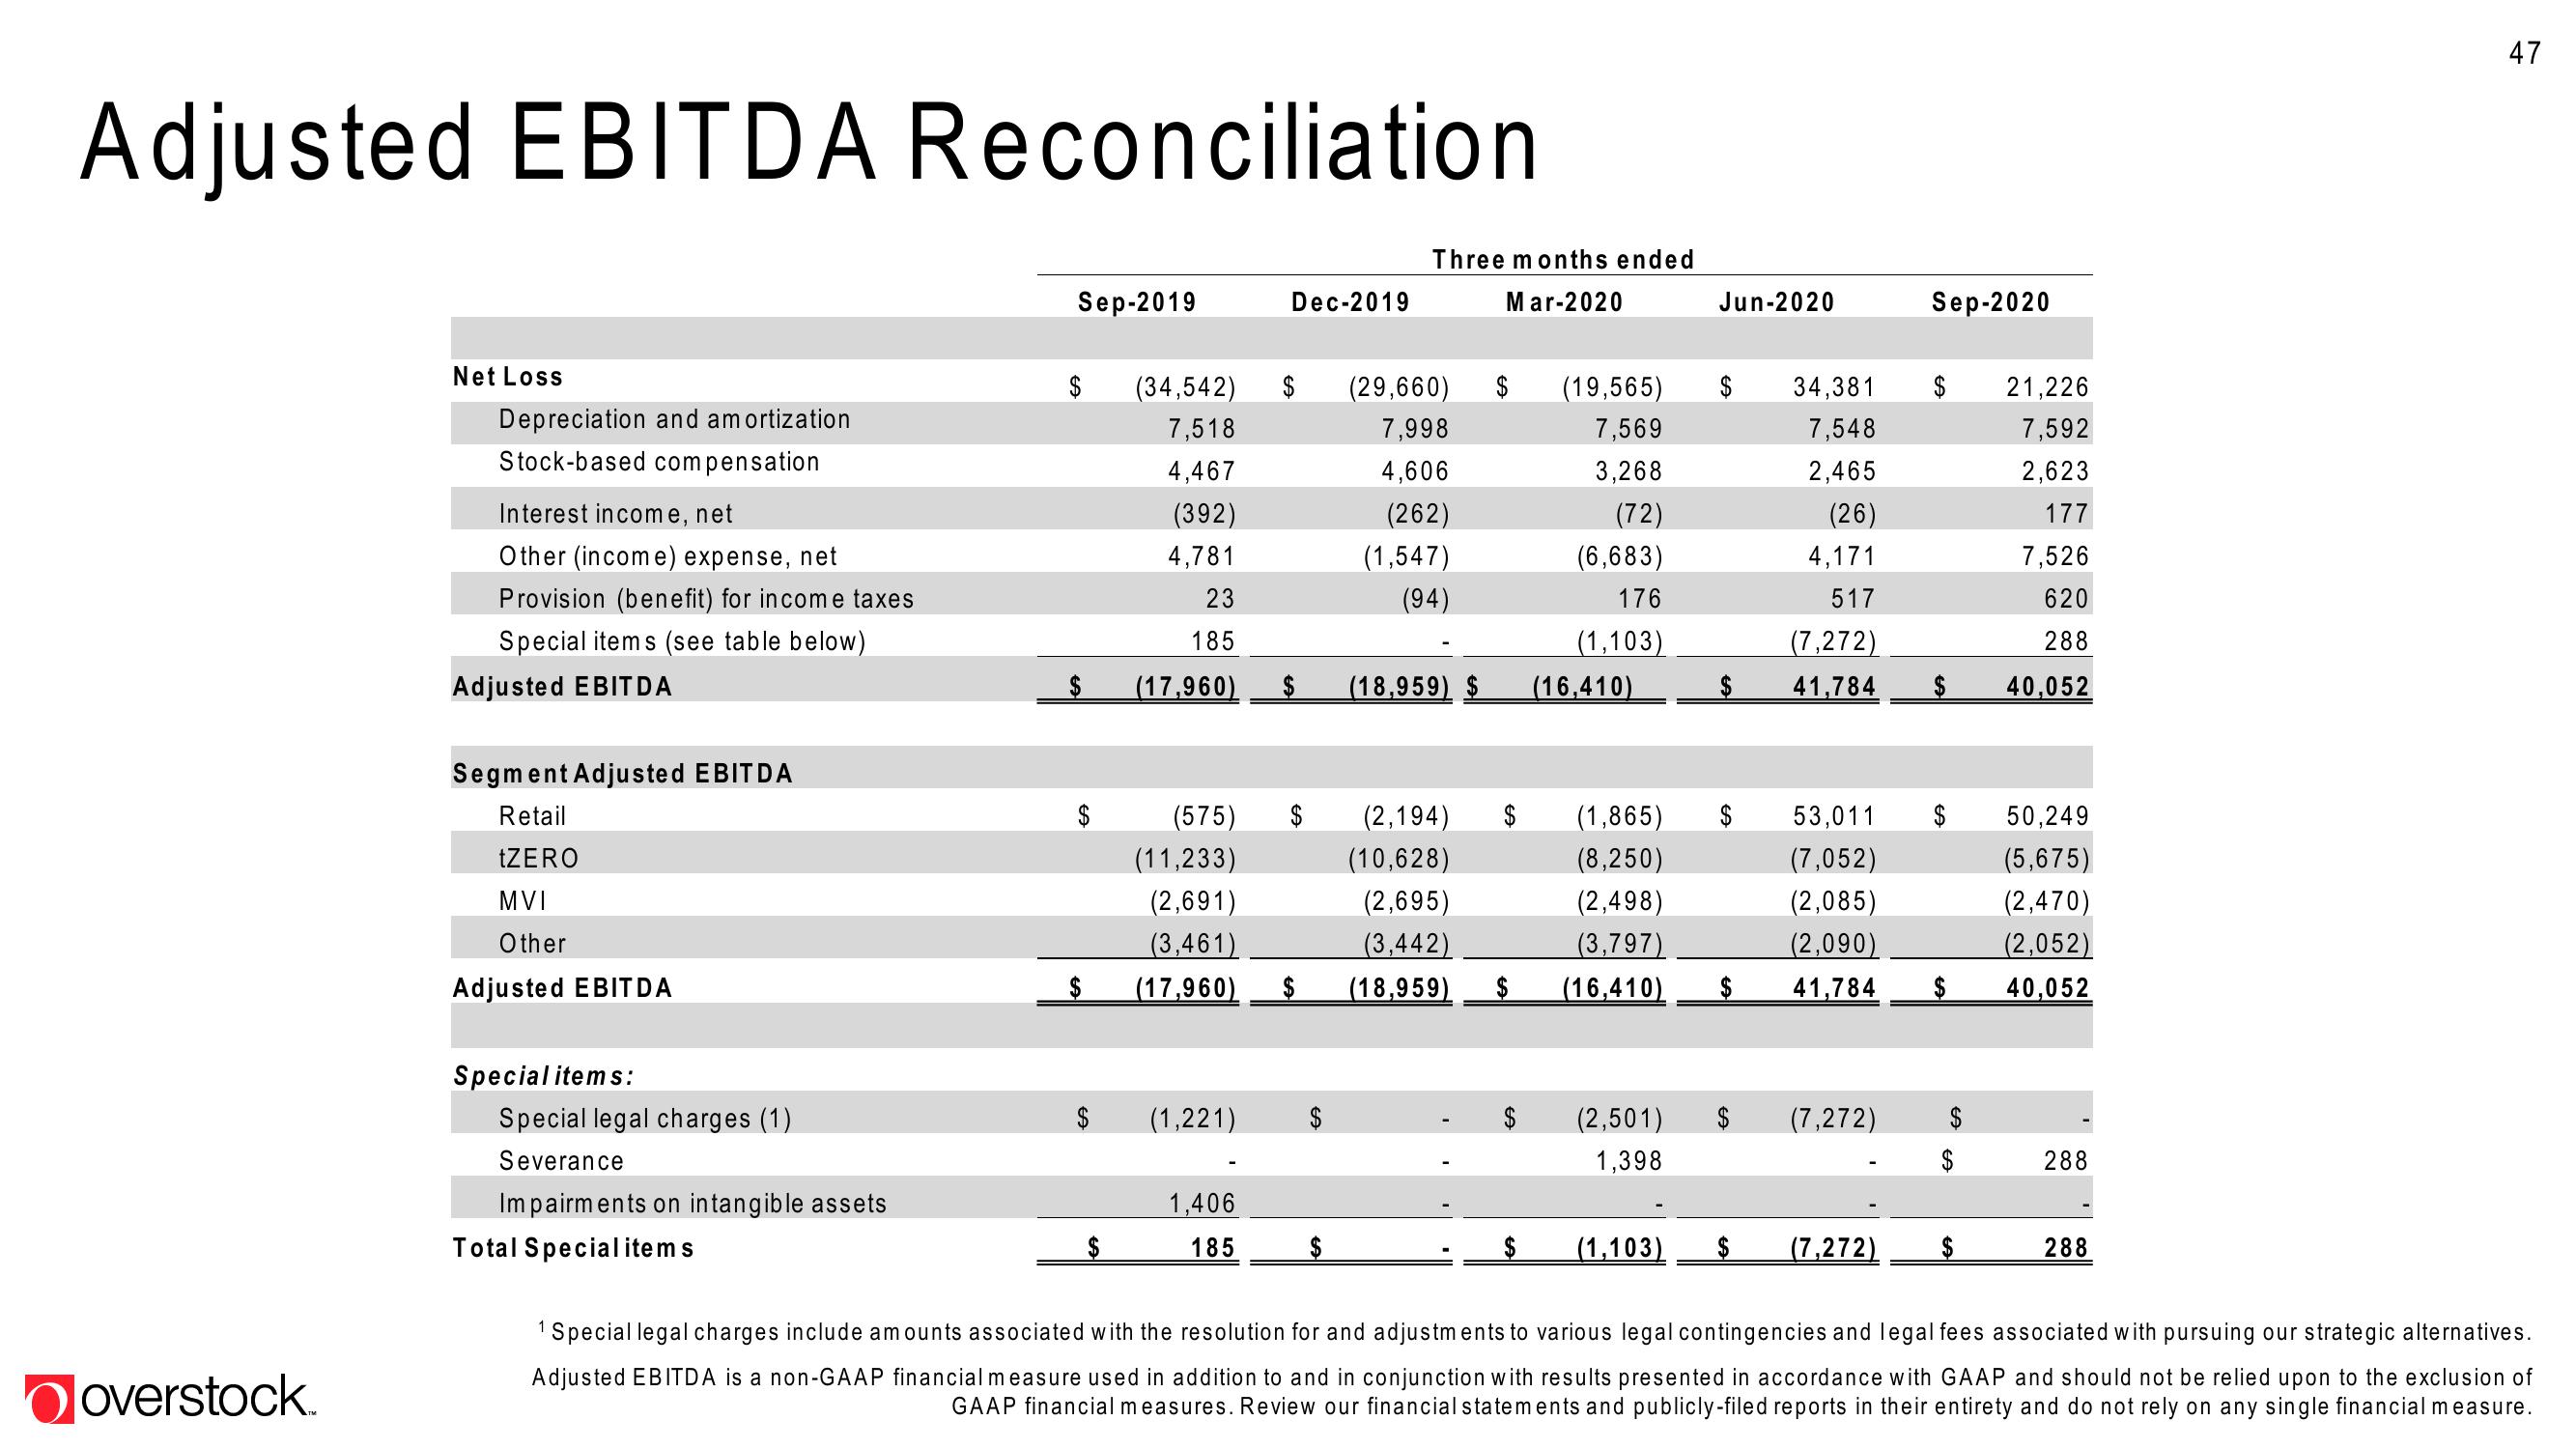
Adjusted EBITDA Reconciliation
overstock.
Net Loss
Depreciation and amortization
Stock-based compensation
Interest income, net
Other (income) expense, net
Provision (benefit) for income taxes
Special items (see table below)
Adjusted EBITDA
Segment Adjusted EBITDA
Retail
tZERO
MVI
Other
Adjusted EBITDA
Special items:
Special legal charges (1)
Severance
Impairments on intangible assets
Total Special items
Sep-2019
$
$
$
(34,542)
7,518
4,467
(392)
4,781
23
185
(17,960)
(575) $
(11,233)
(2,691)
(3,461)
(17,960)
(1,221)
Dec-2019
1,406
185
$
$
Three months ended
Mar-2020
(29,660)
7,998
4,606
(262)
(1,547)
(94)
(18,959) $
(2,194)
(10,628)
(2,695)
(3,442)
(18,959)
$
(19,565) $ 34,381
7,569
7,548
3,268
2,465
(72)
(26)
(6,683)
4,171
176
(1,103)
(16,410)
517
(7,272)
41,784
(1,865)
(8,250)
(2,498)
(3,797)
(16,410)
(2,501)
1,398
Jun-2020
(1,103)
$
$
53,011
(7,052)
(2,085)
(2,090)
41,784
(7,272)
(7,272)
Sep-2020
$
21,226
7,592
2,623
177
7,526
620
288
40,052
50,249
(5,675)
(2,470)
(2,052)
40,052
288
288
47
¹ Special legal charges include amounts associated with the resolution for and adjustments to various legal contingencies and legal fees associated with pursuing our strategic alternatives.
Adjusted EBITDA is a non-GAAP financial measure used in addition to and in conjunction with results presented in accordance with GAAP and should not be relied upon to the exclusion of
GAAP financial measures. Review our financial statements and publicly-filed reports in their entirety and do not rely on any single financial measure.View entire presentation