BlackSky SPAC Presentation Deck
54%
$14
2019A-2021E
CAGR: 71%
$21
Revenue
91% 183% 98% 72%
$40
($ in millions)
BLACK SKY
$114
Revenue Growth and Operating Leverage
$226
$389
40%
$546
2019A 2020A 2021E 2022E 2023E 2024 2025E
Gross Profit
($ in millions)
16% (13%) 20% 62%
Limited Marginal
Costs to Scale
$71
74% 78%
$168
$305
80%
$436
$2 ($3) $8
2019A 2020A 2021E 2022E 2023E 2024 2025E
Adj. EBITDA 1
($ in millions)
Copyright © BlackSky 2021. All rights reserved. Confidential & Proprietary.
2% 32% 46% 45%
$72
$177
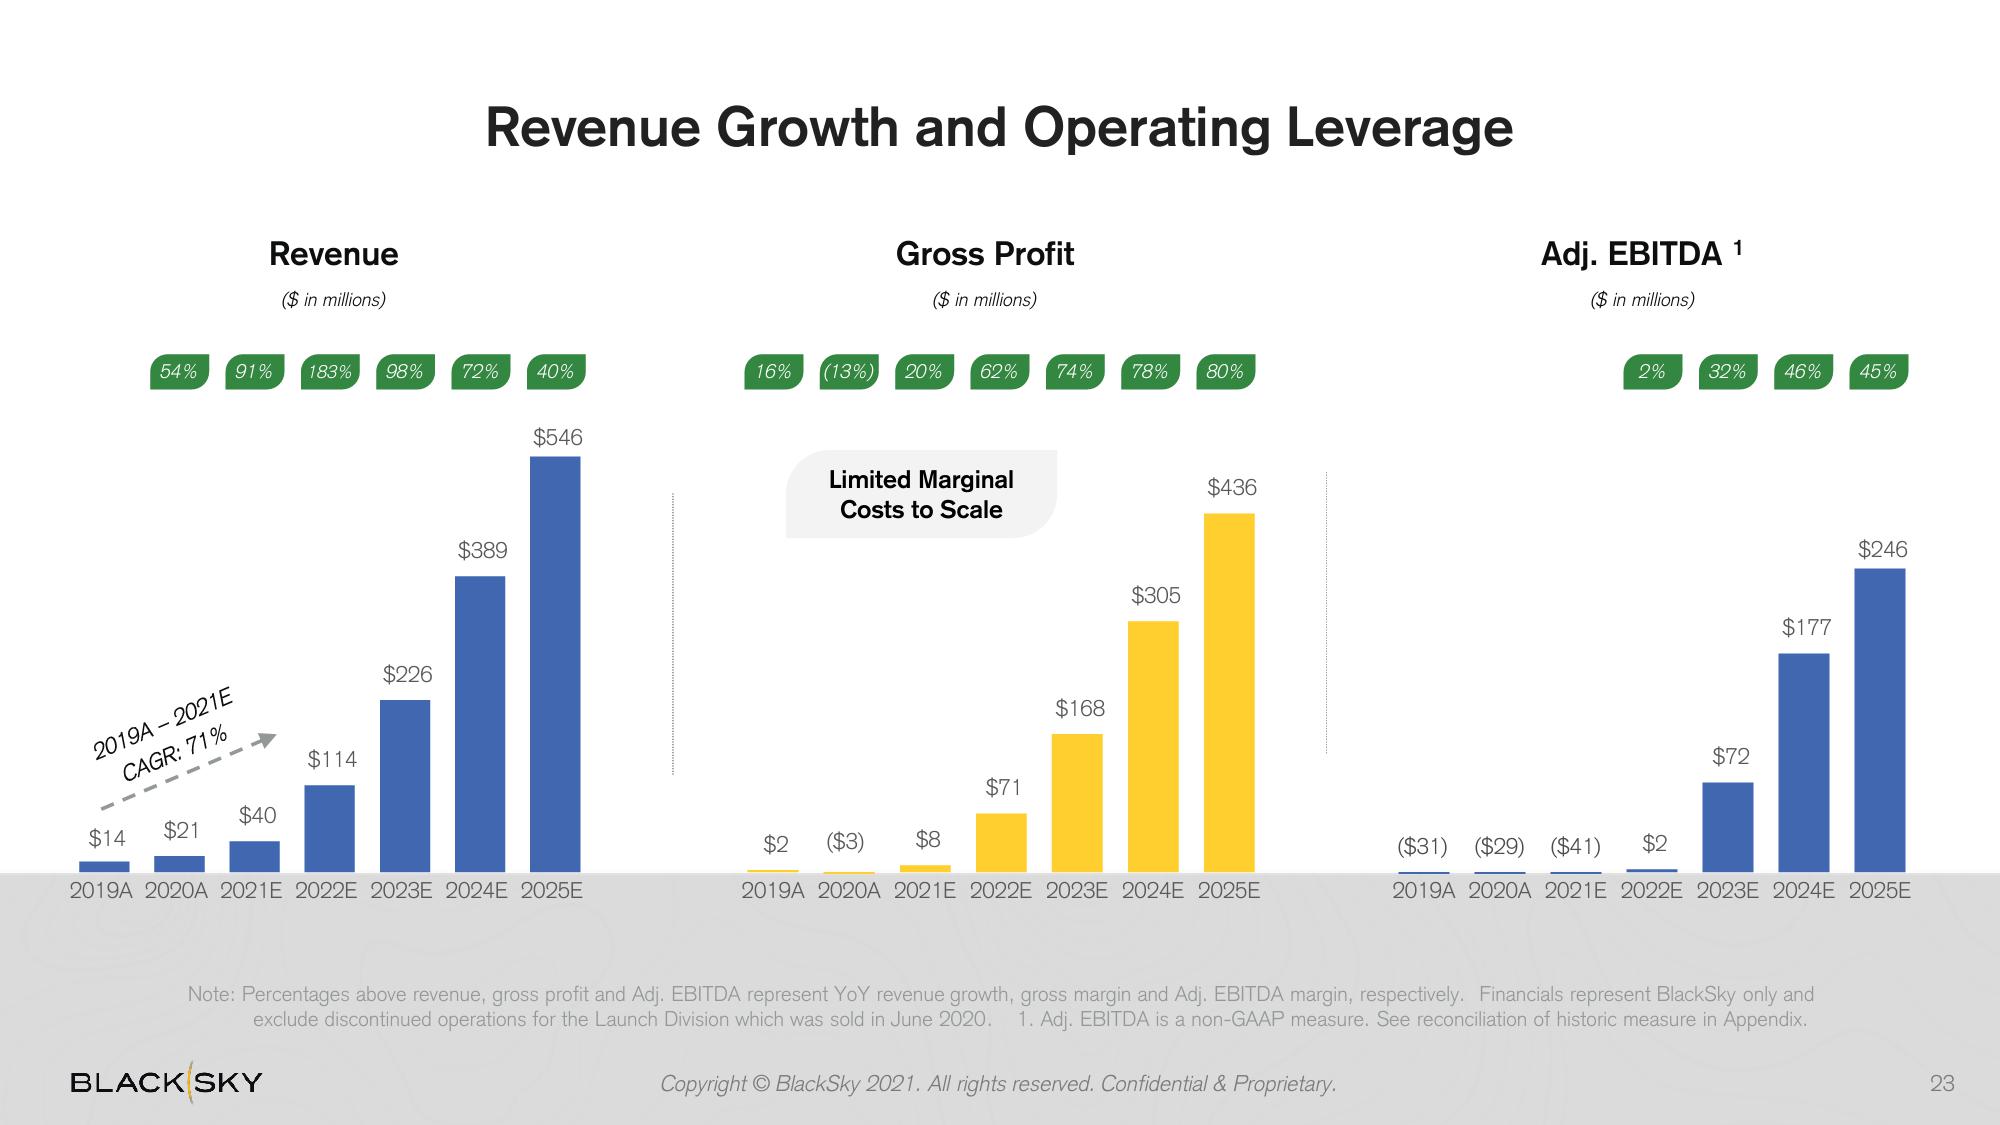
Note: Percentages above revenue, gross profit and Adj. EBITDA represent YoY revenue growth, gross margin and Adj. EBITDA margin, respectively. Financials represent BlackSky only and
exclude discontinued operations for the Launch Division which was sold in June 2020. 1. Adj. EBITDA is a non-GAAP measure. See reconciliation of historic measure in Appendix.
$246
($31) ($29) ($41) $2
2019A 2020A 2021E 2022E 2023E 2024 2025E
23View entire presentation