jetBlue Results Presentation Deck
DELIVERING FOR OUR CUSTOMERS AND BUILDING RELEVANCE
jetBlue
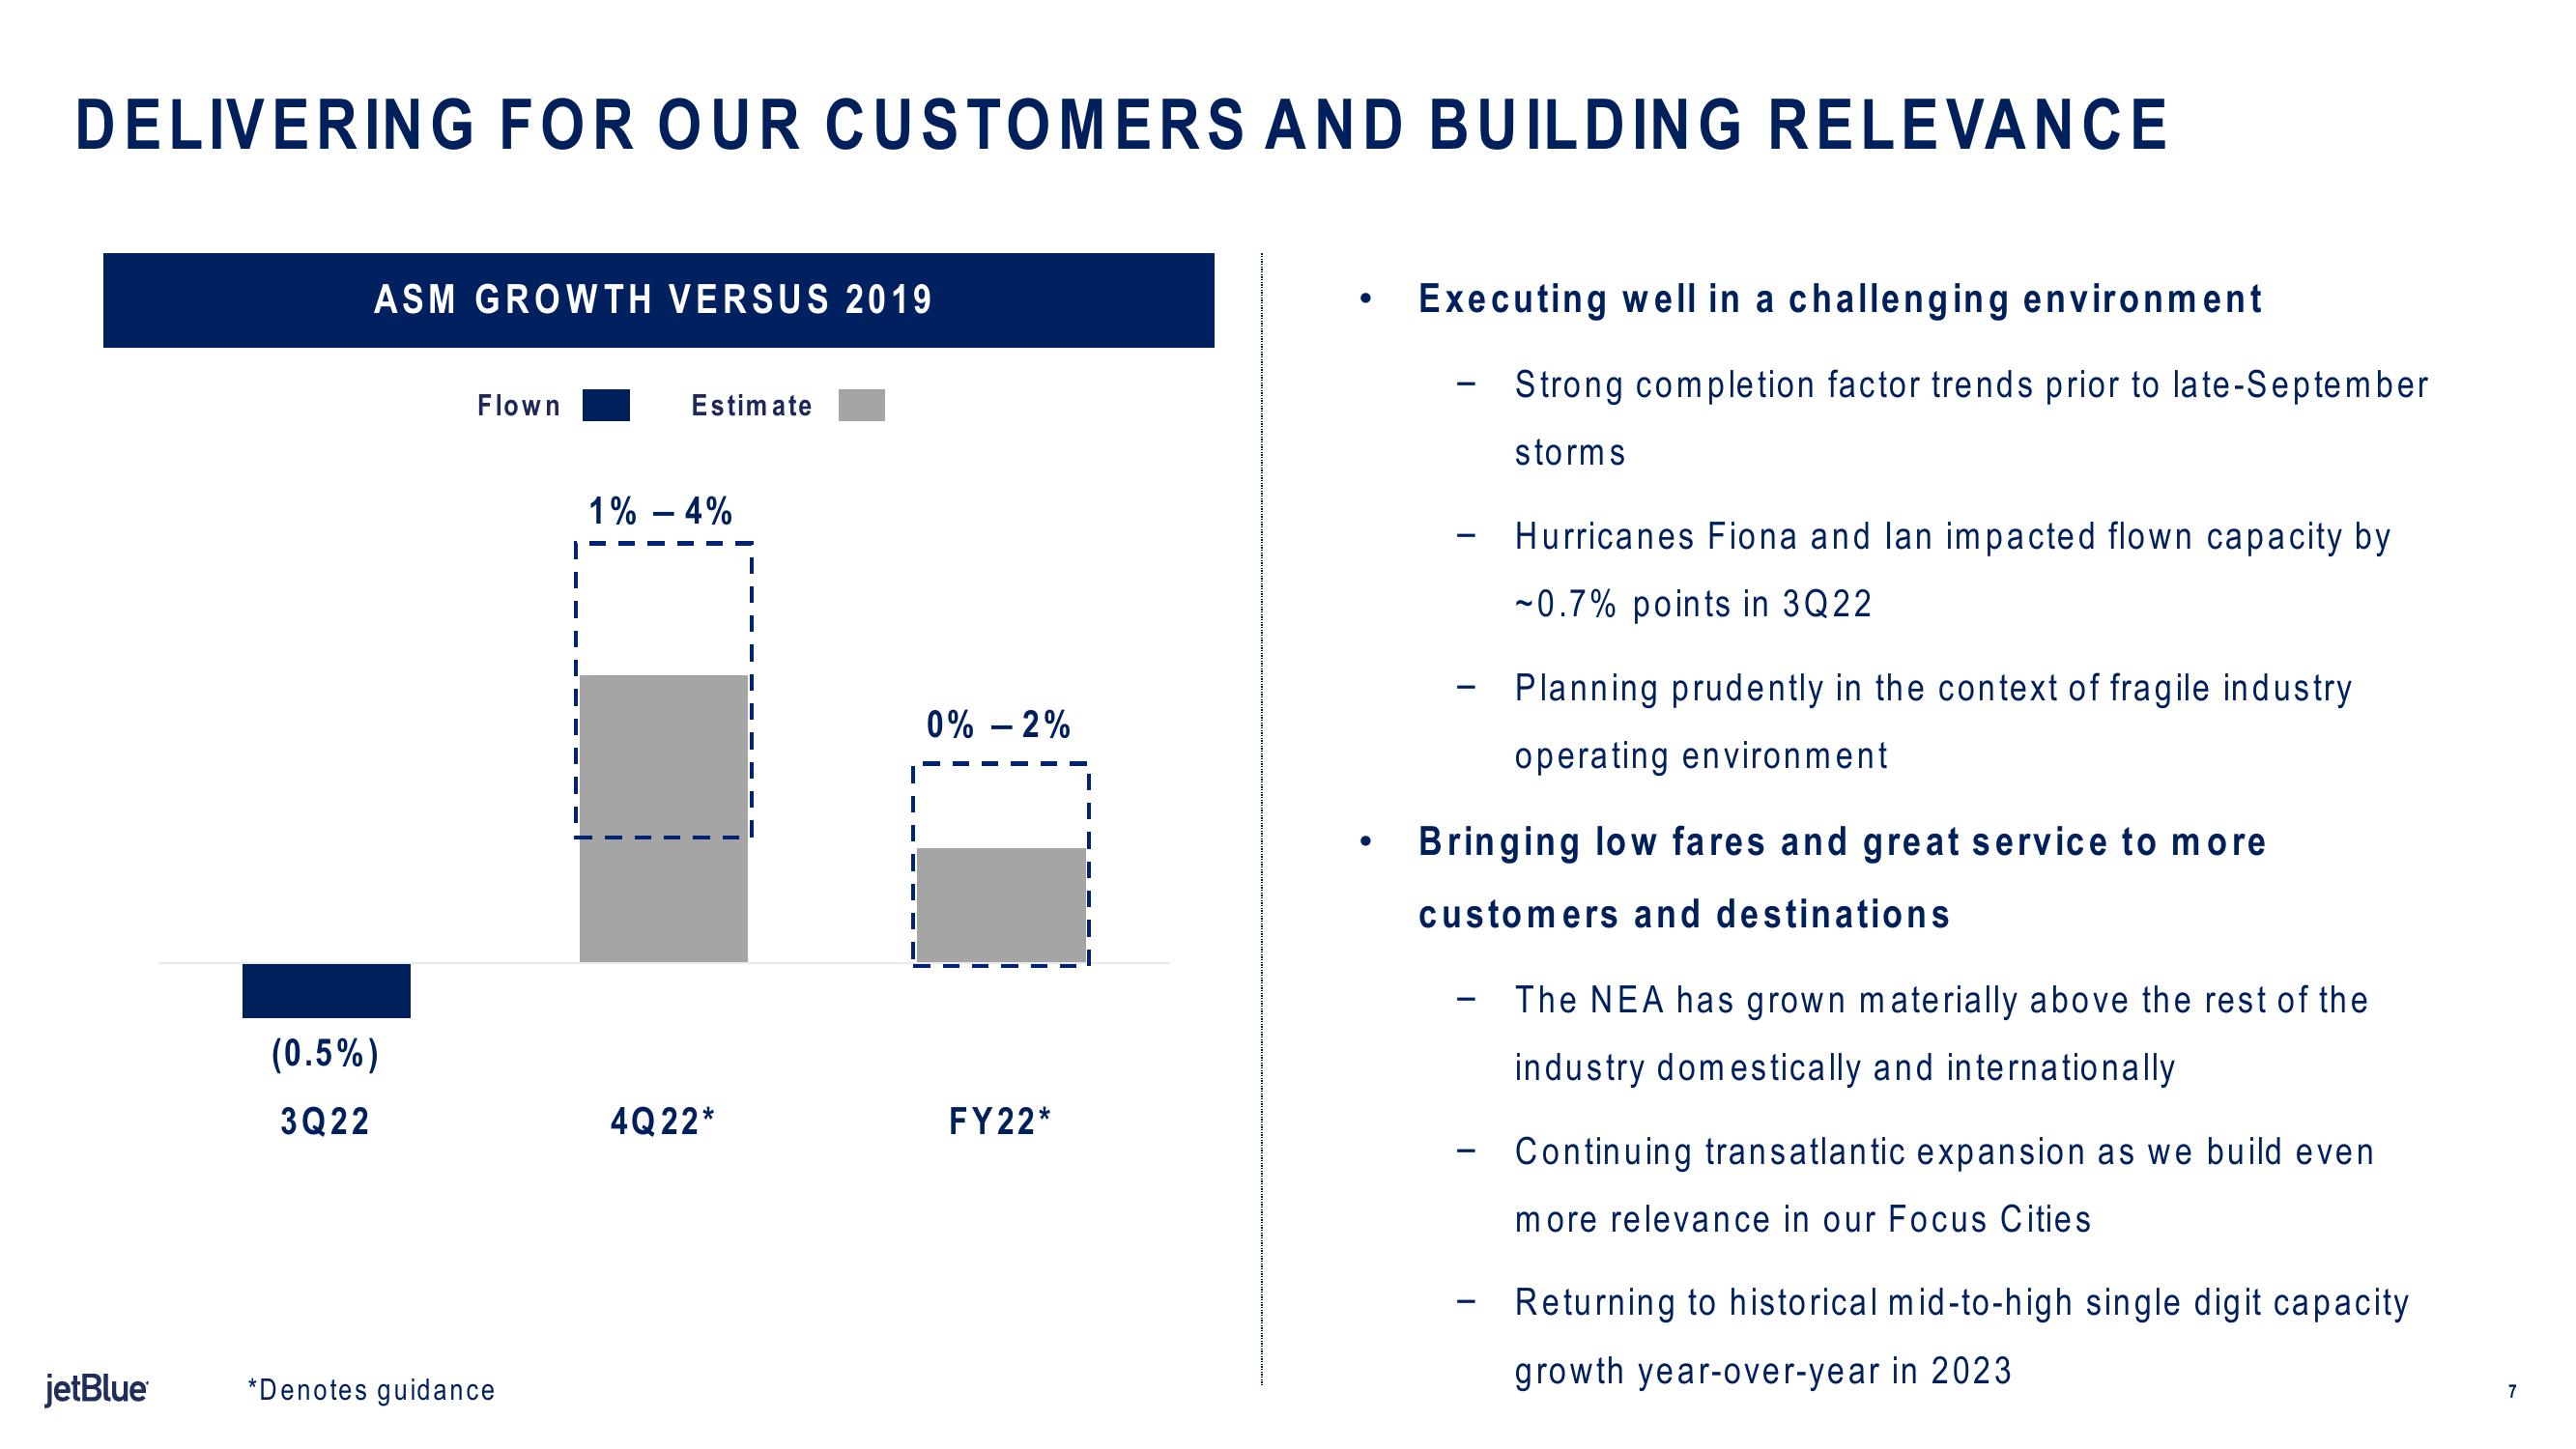
ASM GROWTH VERSUS 2019
(0.5%)
3Q22
Flown
*Denotes guidance
I
1
Estimate
1% -4%
4Q 22*
0% -2%
T
FY22*
Executing well in a challenging environment
-
-
Strong completion factor trends prior to late-September
storms
-
Hurricanes Fiona and lan impacted flown capacity by
-0.7% points in 3Q22
Planning prudently in the context of fragile industry
operating environment.
Bringing low fares and great service to more
customers and destinations
The NEA has grown materially above the rest of the
industry domestically and internationally
Continuing transatlantic expansion as we build even
more relevance in our Focus Cities
Returning to historical mid-to-high single digit capacity
growth year-over-year in 2023
7View entire presentation