Paysafe Results Presentation Deck
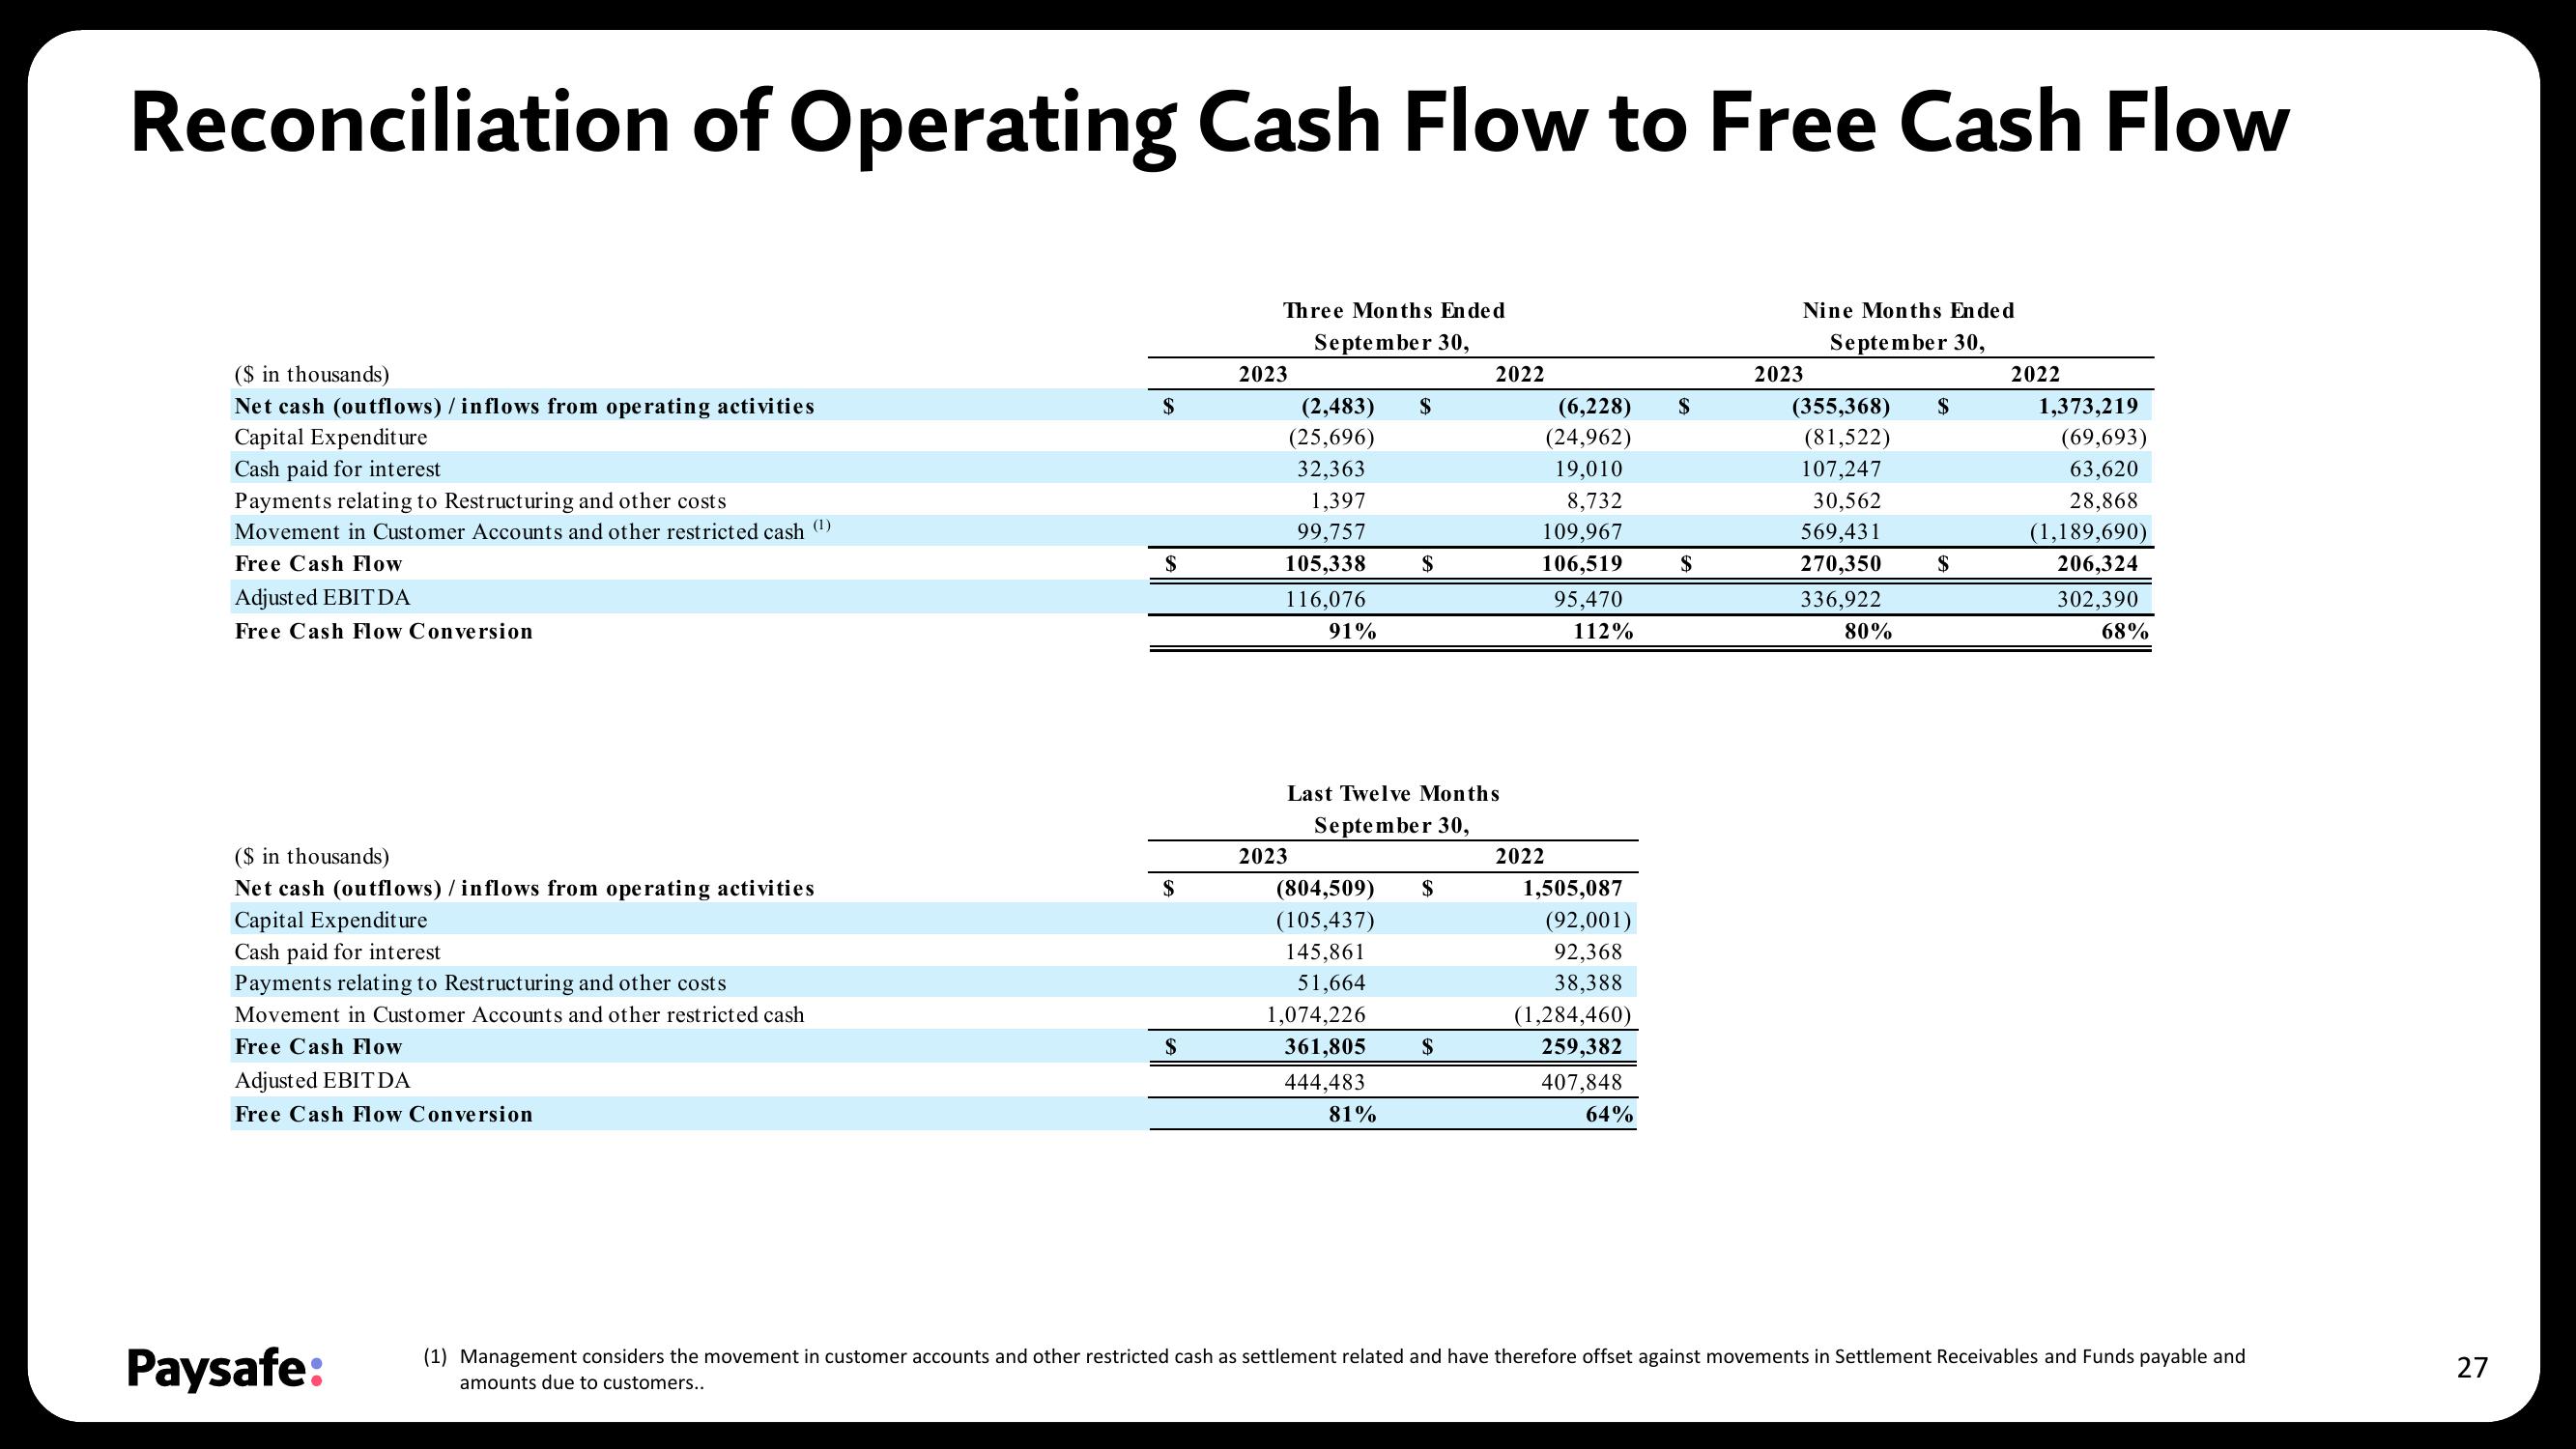
Reconciliation of Operating Cash Flow to Free Cash Flow
($ in thousands)
Net cash (outflows) / inflows from operating activities
Capital Expenditure
Cash paid for interest
Payments relating to Restructuring and other costs
Movement in Customer Accounts and other restricted cash (¹)
Free Cash Flow
Adjusted EBITDA
Free Cash Flow Conversion
($ in thousands)
Net cash (outflows) / inflows from operating activities
Capital Expenditure
Cash paid for interest
Payments relating to Restructuring and other costs
Movement in Customer Accounts and other restricted cash
Free Cash Flow
Adjusted EBITDA
Free Cash Flow Conversion
Paysafe:
$
$
$
$
Three Months Ended
September 30,
2023
(2,483) $
(25,696)
32,363
1,397
99,757
105,338
116,076
91%
2023
$
Last Twelve Months
September 30,
(804,509) $
(105,437)
145,861
51,664
1,074,226
361,805
444,483
81%
2022
$
(6,228)
(24,962)
19,010
8,732
109,967
106,519
95,470
112%
2022
1,505,087
(92,001)
92,368
38,388
(1,284,460)
259,382
407,848
64%
$
$
Nine Months Ended
September 30,
2023
(355,368) $
(81,522)
107,247
30,562
569,431
270,350
336,922
80%
$
2022
1,373,219
(69,693)
63,620
28,868
(1,189,690)
206,324
302,390
68%
(1) Management considers the movement in customer accounts and other restricted cash as settlement related and have therefore offset against movements in Settlement Receivables and Funds payable and
amounts due to customers..
27View entire presentation