Spotify Results Presentation Deck
Operating Expenses
Primarily driven by efficiency related charges
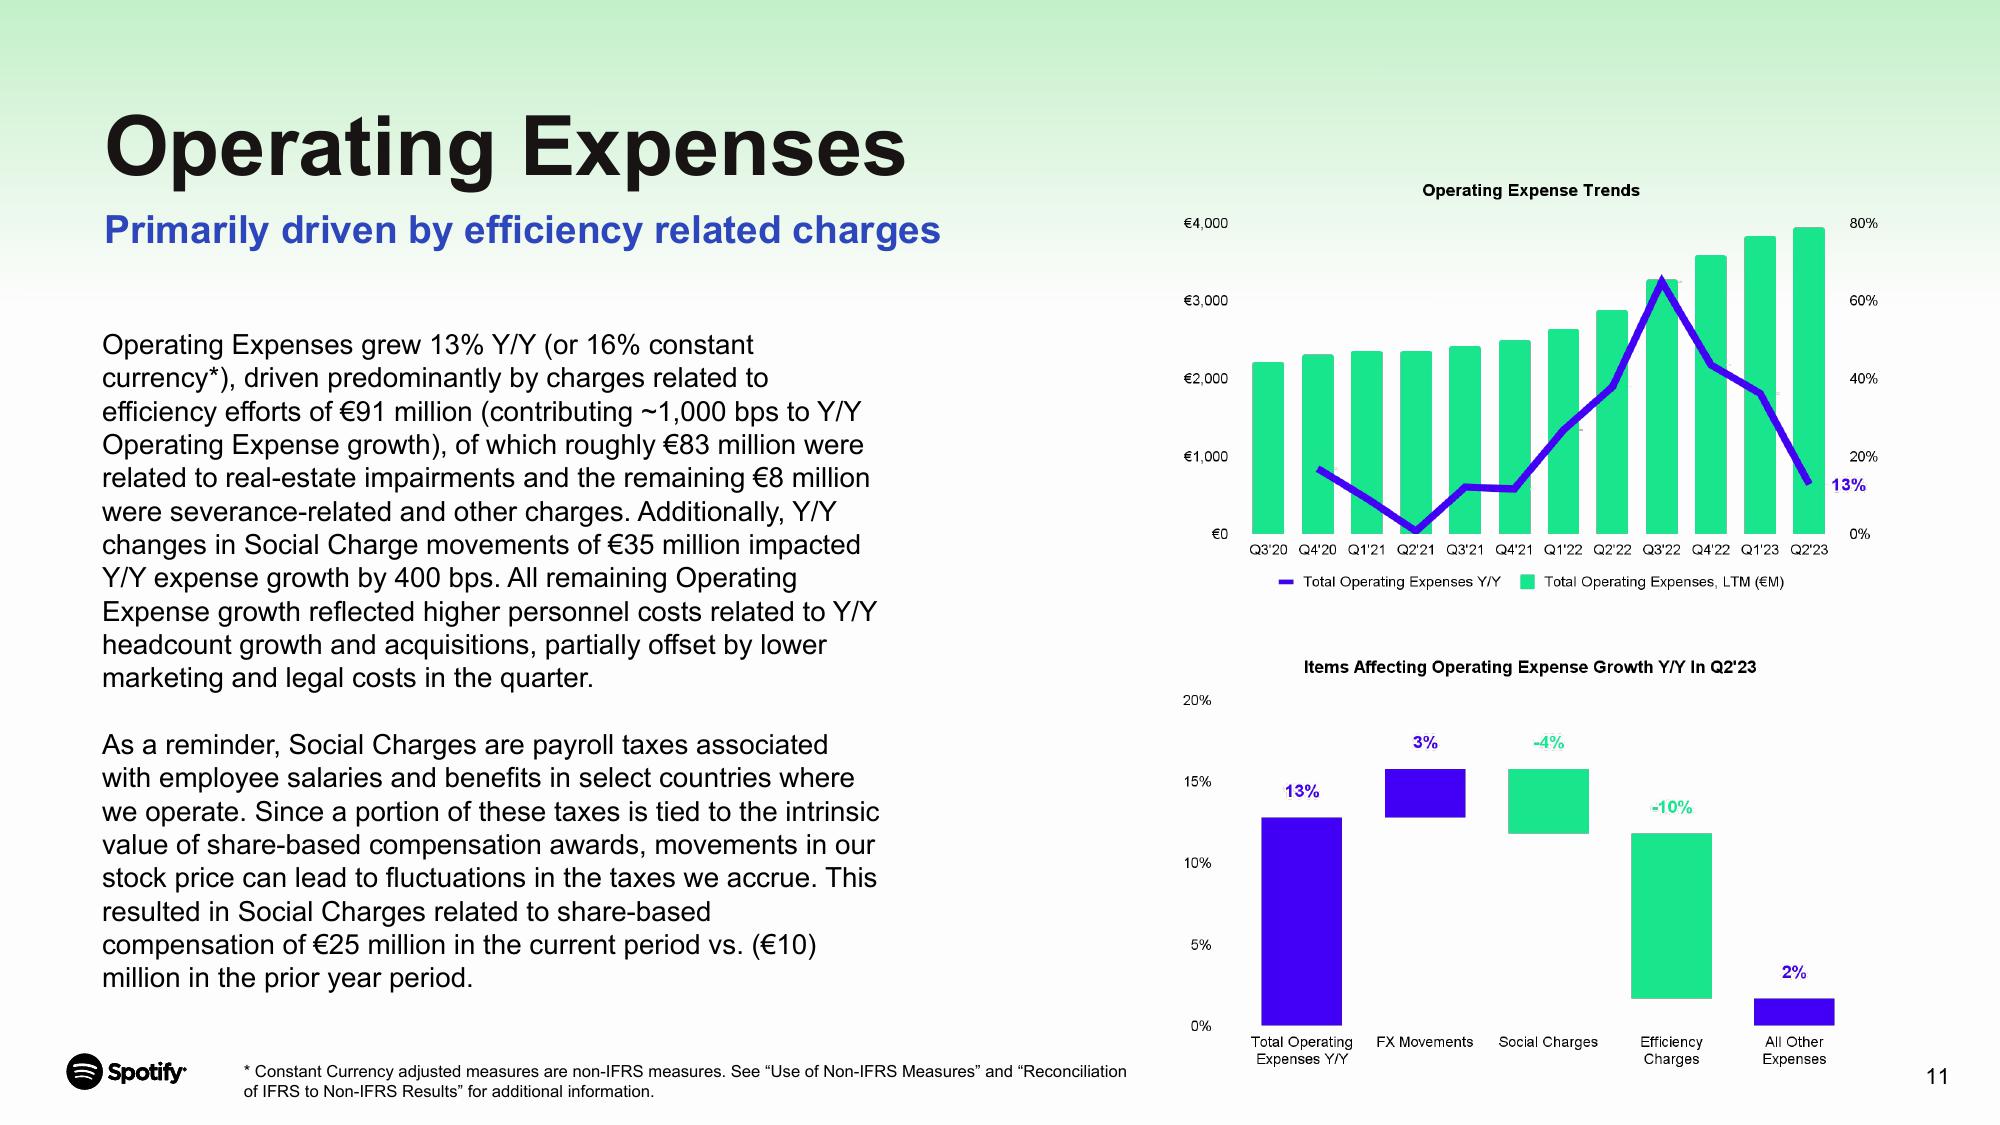
Operating Expenses grew 13% Y/Y (or 16% constant
currency*), driven predominantly by charges related to
efficiency efforts of €91 million (contributing ~1,000 bps to Y/Y
Operating Expense growth), of which roughly €83 million were
related to real-estate impairments and the remaining €8 million
were severance-related and other charges. Additionally, Y/Y
changes in Social Charge movements of €35 million impacted
Y/Y expense growth by 400 bps. All remaining Operating
Expense growth reflected higher personnel costs related to Y/Y
headcount growth and acquisitions, partially offset by lower
marketing and legal costs in the quarter.
As a reminder, Social Charges are payroll taxes associated
with employee salaries and benefits in select countries where
we operate. Since a portion of these taxes is tied to the intrinsic
value of share-based compensation awards, movements in our
stock price can lead to fluctuations in the taxes we accrue. This
resulted in Social Charges related to share-based
compensation of €25 million in the current period vs. (€10)
million in the prior year period.
Spotify
* Constant Currency adjusted measures are non-IFRS measures. See "Use of Non-IFRS Measures" and "Reconciliation
of IFRS to Non-IFRS Results" for additional information.
€4,000
€3,000
€2,000
€1,000
20%
15%
10%
5%
€0
0%
Operating Expense Trends
INMI
Q3'20 Q4'20 Q1'21 Q2'21 Q3'21 Q4'21 Q1'22 Q2'22 Q3'22 Q4'22 Q1'23 Q2'23
- Total Operating Expenses Y/Y Total Operating Expenses, LTM (EM)
13%
Items Affecting Operating Expense Growth Y/Y In Q2¹23
Total Operating
Expenses Y/Y
3%
FX Movements
TH
-4%
Social Charges
-10%
Efficiency
Charges
2%
All Other
Expenses
80%
60%
40%
20%
13%
0%
11View entire presentation