J.P.Morgan Results Presentation Deck
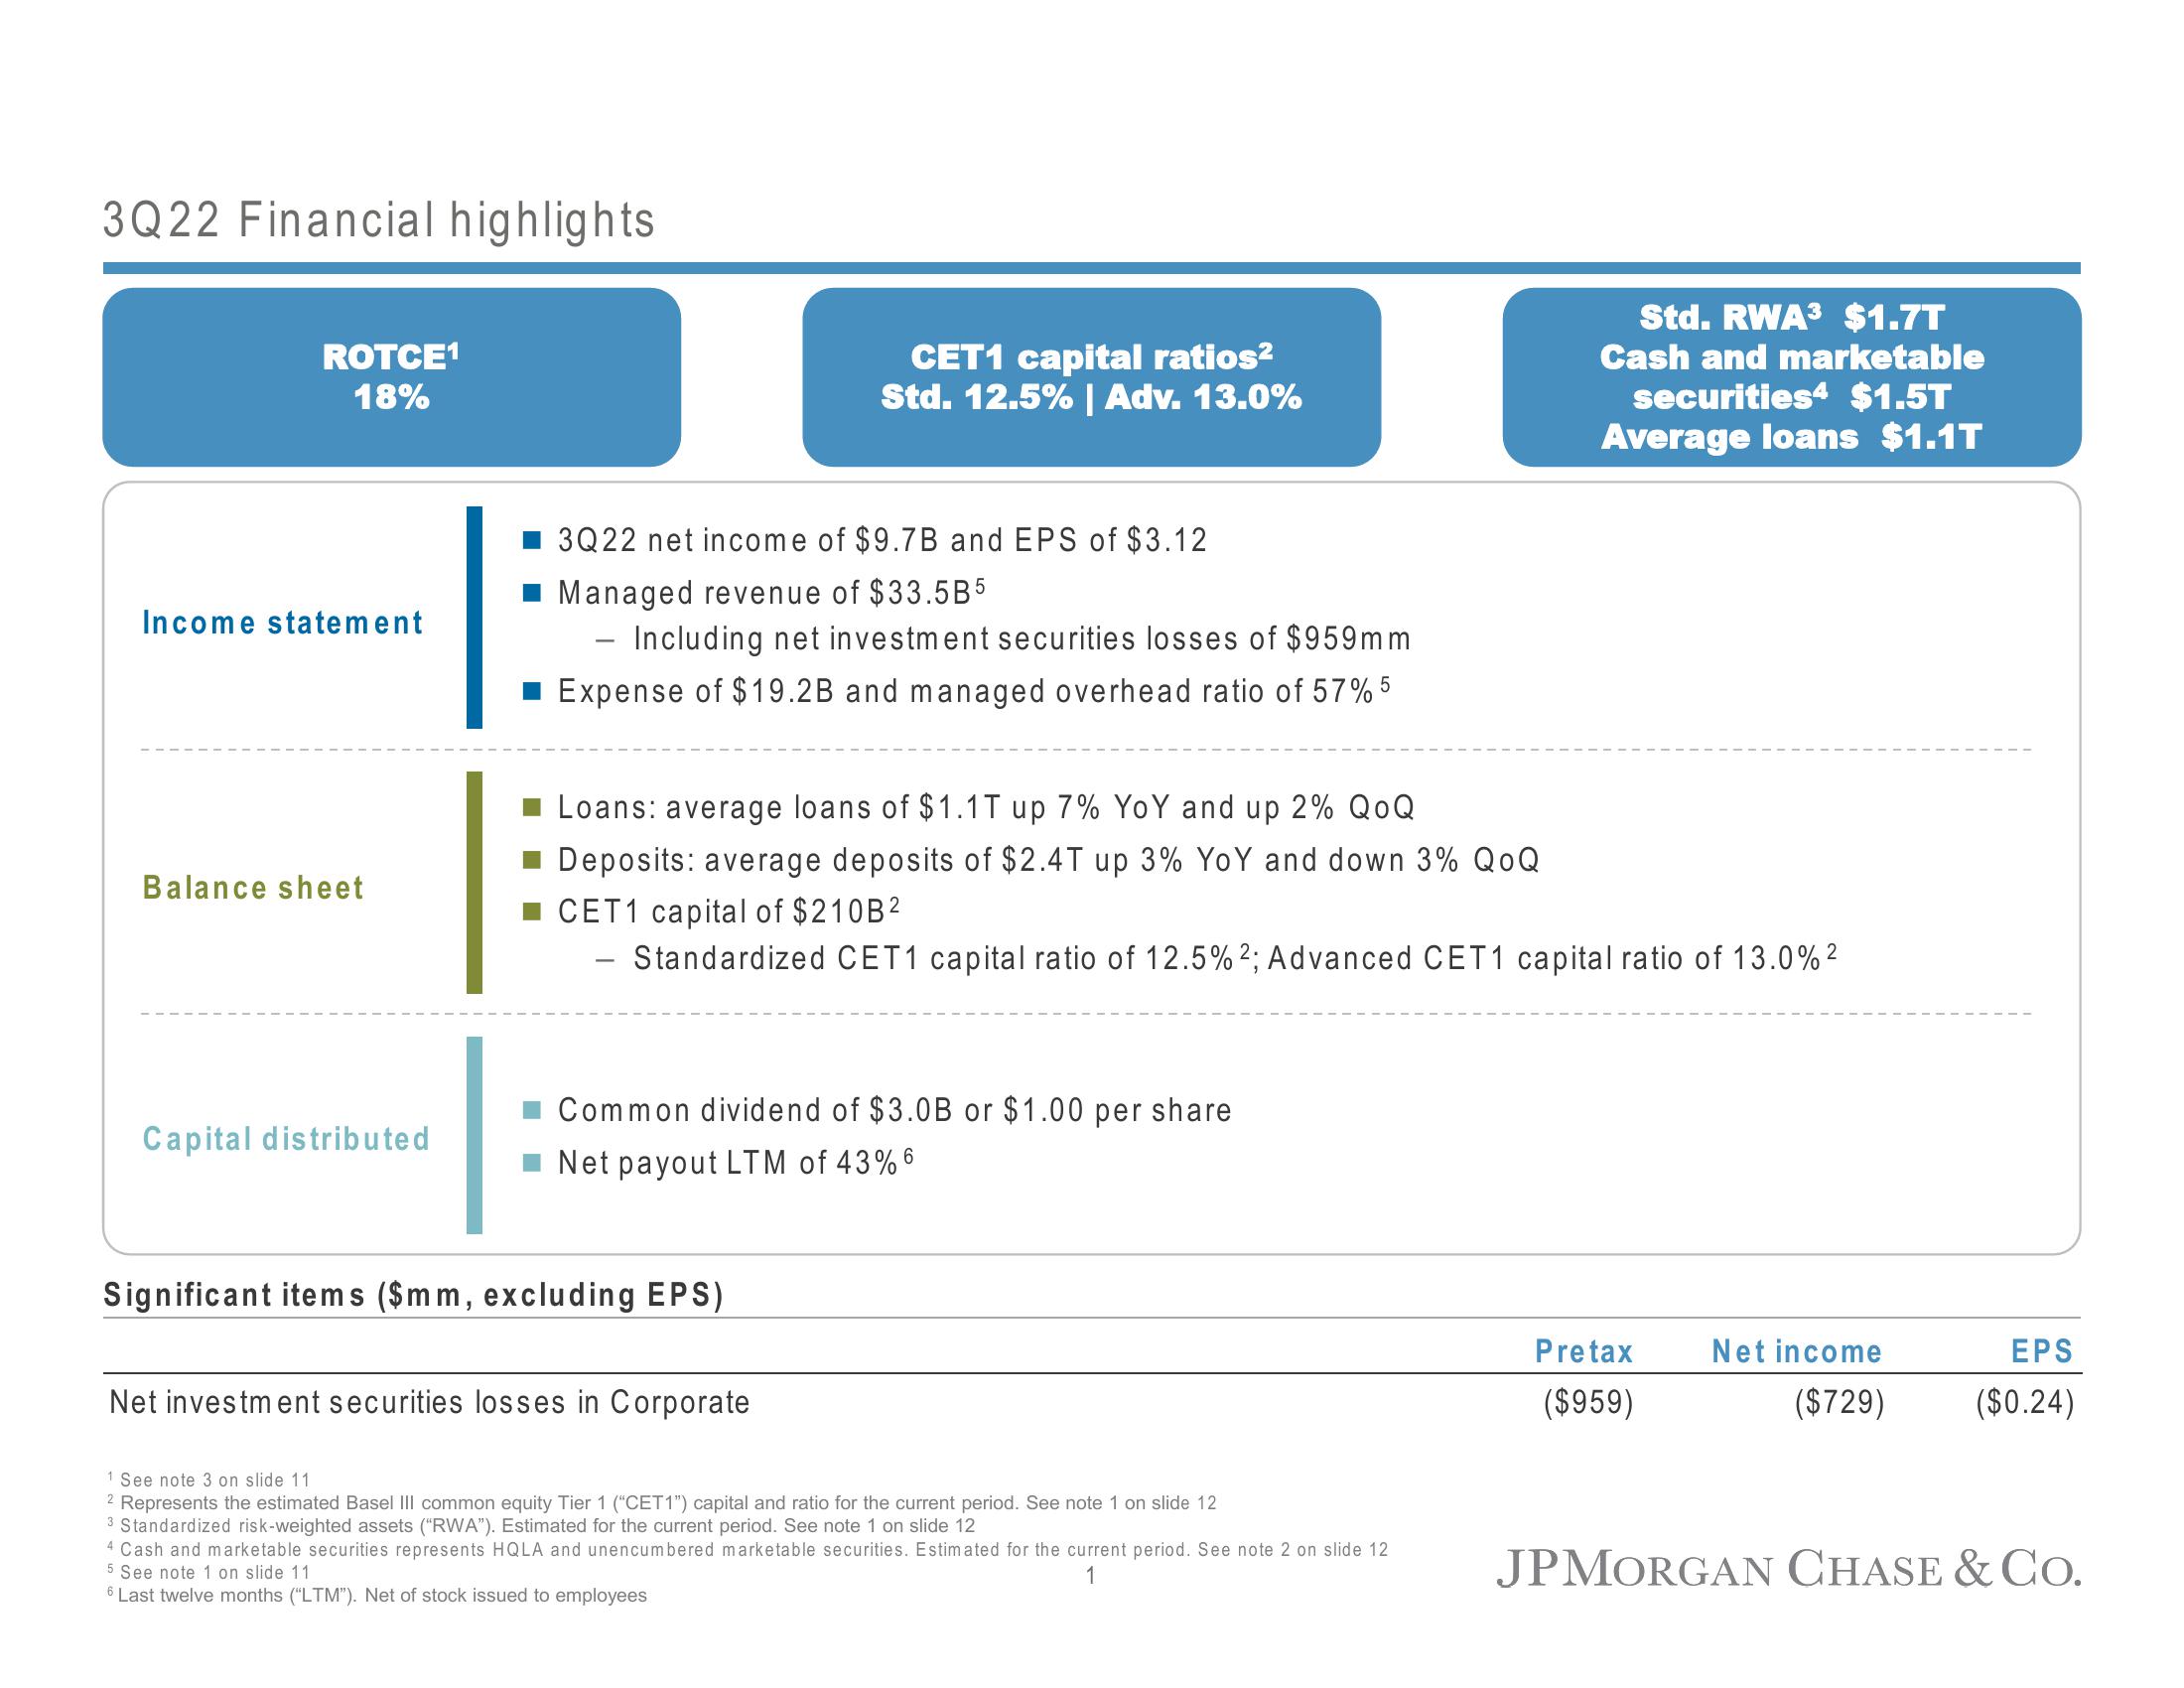
3Q22 Financial highlights
ROTCE¹
18%
Income statement
Balance sheet
Capital distributed
■3Q22 net income of $9.7B and EPS of $3.12
Managed revenue of $33.5B5
Including net investment securities losses of $959mm
■ Expense of $19.2B and managed overhead ratio of 57% 5
CET1 capital ratios²
Std. 12.5% | Adv. 13.0%
■ Loans: average loans of $1.1T up 7% YoY and up 2% QOQ
■ Deposits: average deposits of $2.4T up 3% YoY and down 3% QoQ
CET1 capital of $210B²
Standardized CET1 capital ratio of 12.5% 2; Advanced CET1 capital ratio of 13.0% ²
Common dividend of $3.0B or $1.00 per share
Net payout LTM of 43% 6
Significant items ($mm, excluding EPS)
Net investment securities losses in Corporate
Std. RWA³ $1.7T
Cash and marketable
securities4 $1.5T
Average loans $1.1T
1 See note 3 on slide 11
2 Represents the estimated Basel III common equity Tier 1 ("CET1") capital and ratio for the current period. See note 1 on slide 12
3 Standardized risk-weighted assets ("RWA"). Estimated for the current period. See note 1 on slide 12
4 Cash and marketable securities represents HQLA and unencumbered marketable securities. Estimated for the current period. See note 2 on slide 12
5 See note 1 on slide 11
1
6 Last twelve months ("LTM"). Net of stock issued to employees
Pretax
($959)
Net income
($729)
EPS
($0.24)
JPMORGAN CHASE & Co.View entire presentation