BigCommerce Results Presentation Deck slide image

BigCommerce Results Presentation Deck

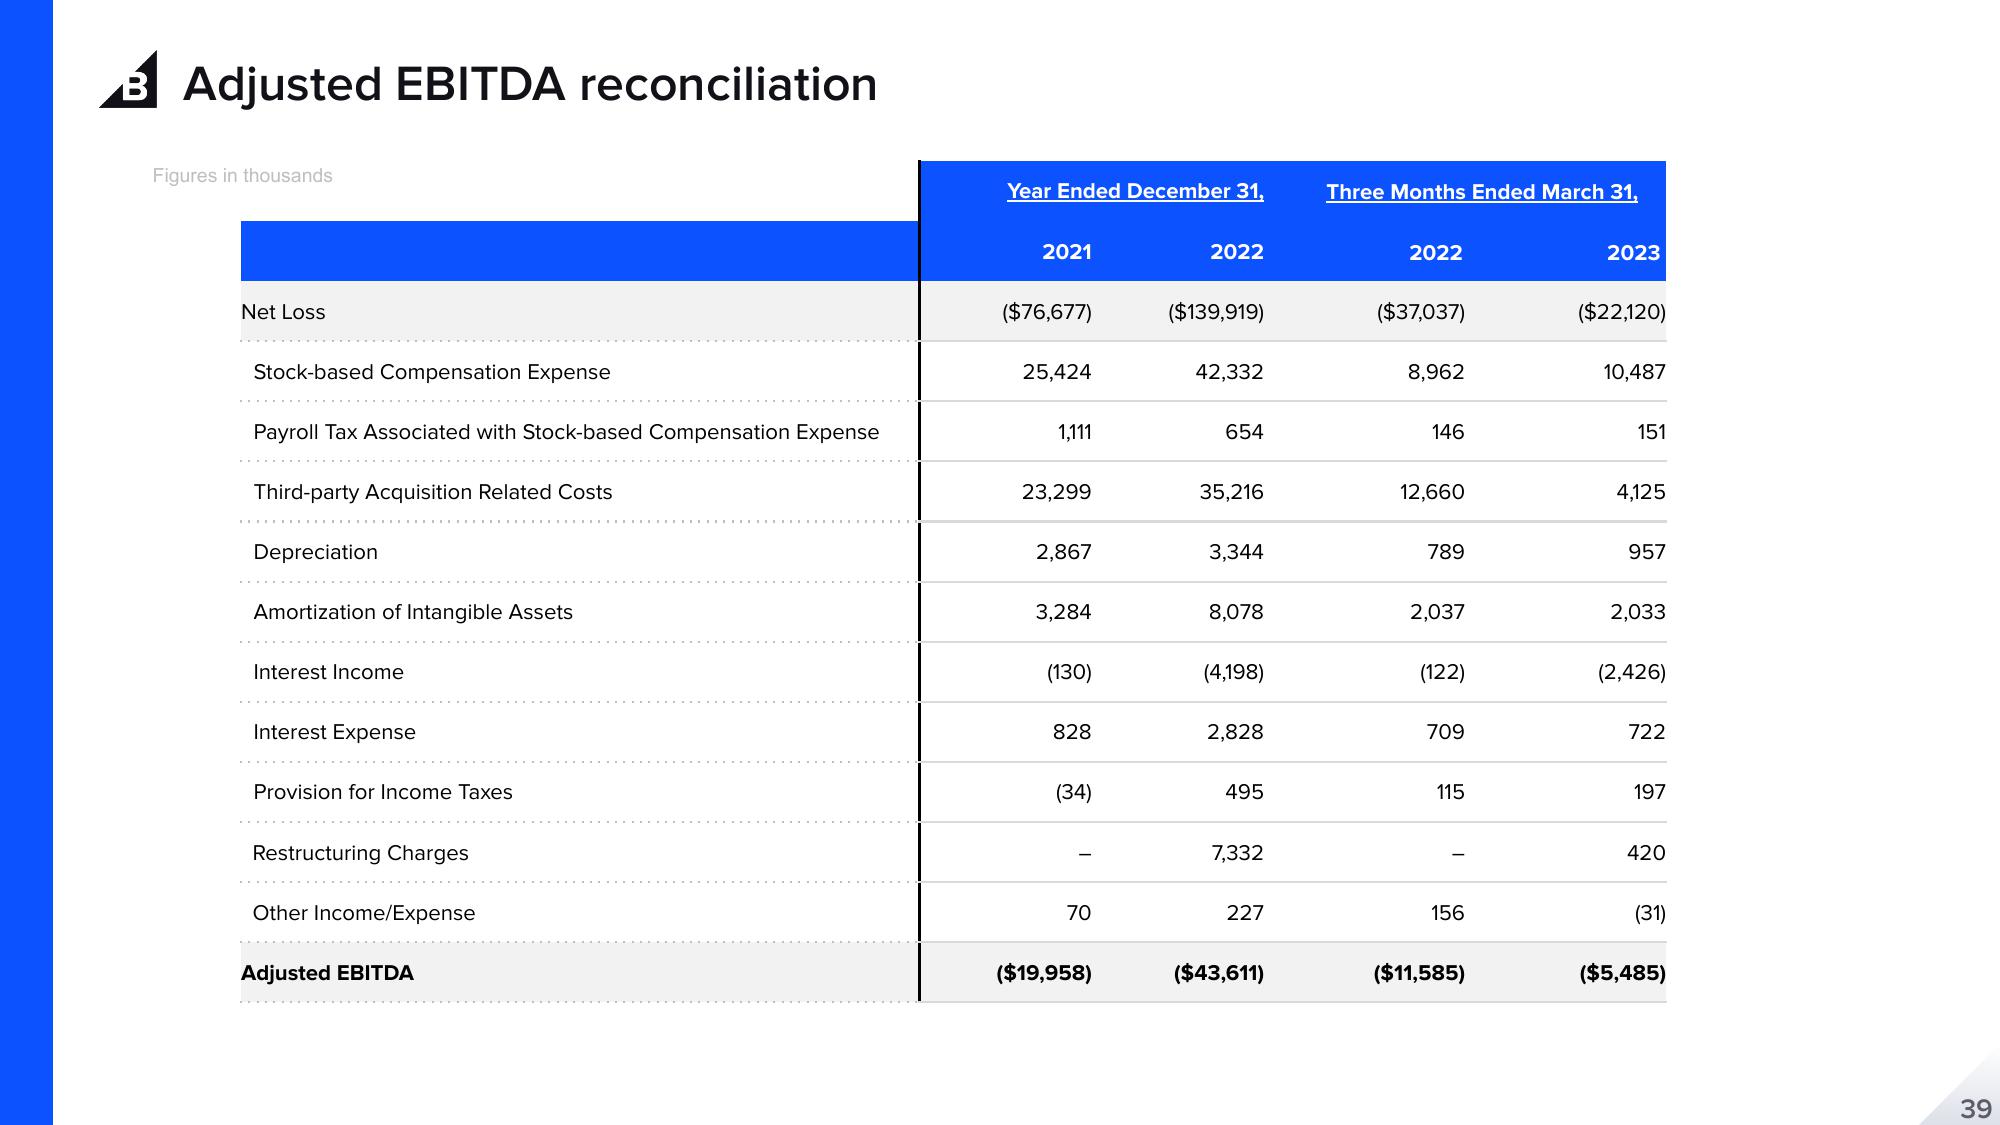
Adjusted EBITDA reconciliation Figures in thousands Net Loss Stock-based Compensation Expense Payroll Tax Associated with Stock-based Compensation Expense Third-party Acquisition Related Costs Depreciation Amortization of Intangible Assets Interest Income Interest Expense Provision for Income Taxes Restructuring Charges Other Income/Expense Adjusted EBITDA Year Ended December 31, 2021 ($76,677) 25,424 1,111 23,299 2,867 3,284 (130) 828 (34) 70 ($19,958) 2022 ($139,919) 42,332 654 35,216 3,344 8,078 (4,198) 2,828 495 7,332 227 ($43,611) Three Months Ended March 31, 2022 ($37,037) 8,962 146 12,660 789 2,037 (122) 709 115 156 ($11,585) 2023 ($22,120) 10,487 151 4,125 957 2,033 (2,426) 722 197 420 (31) ($5,485) 39
View entire presentation