Grove Results Presentation Deck
Q3 Fiscal 2022 • Financial Highlights
$80
$60
$40
$20
$0
DTC NET REVENUE PER ORDER
$41
2019
$53
2020
$56
2021
T
$56
Q3-2021
$61
Q3-2022
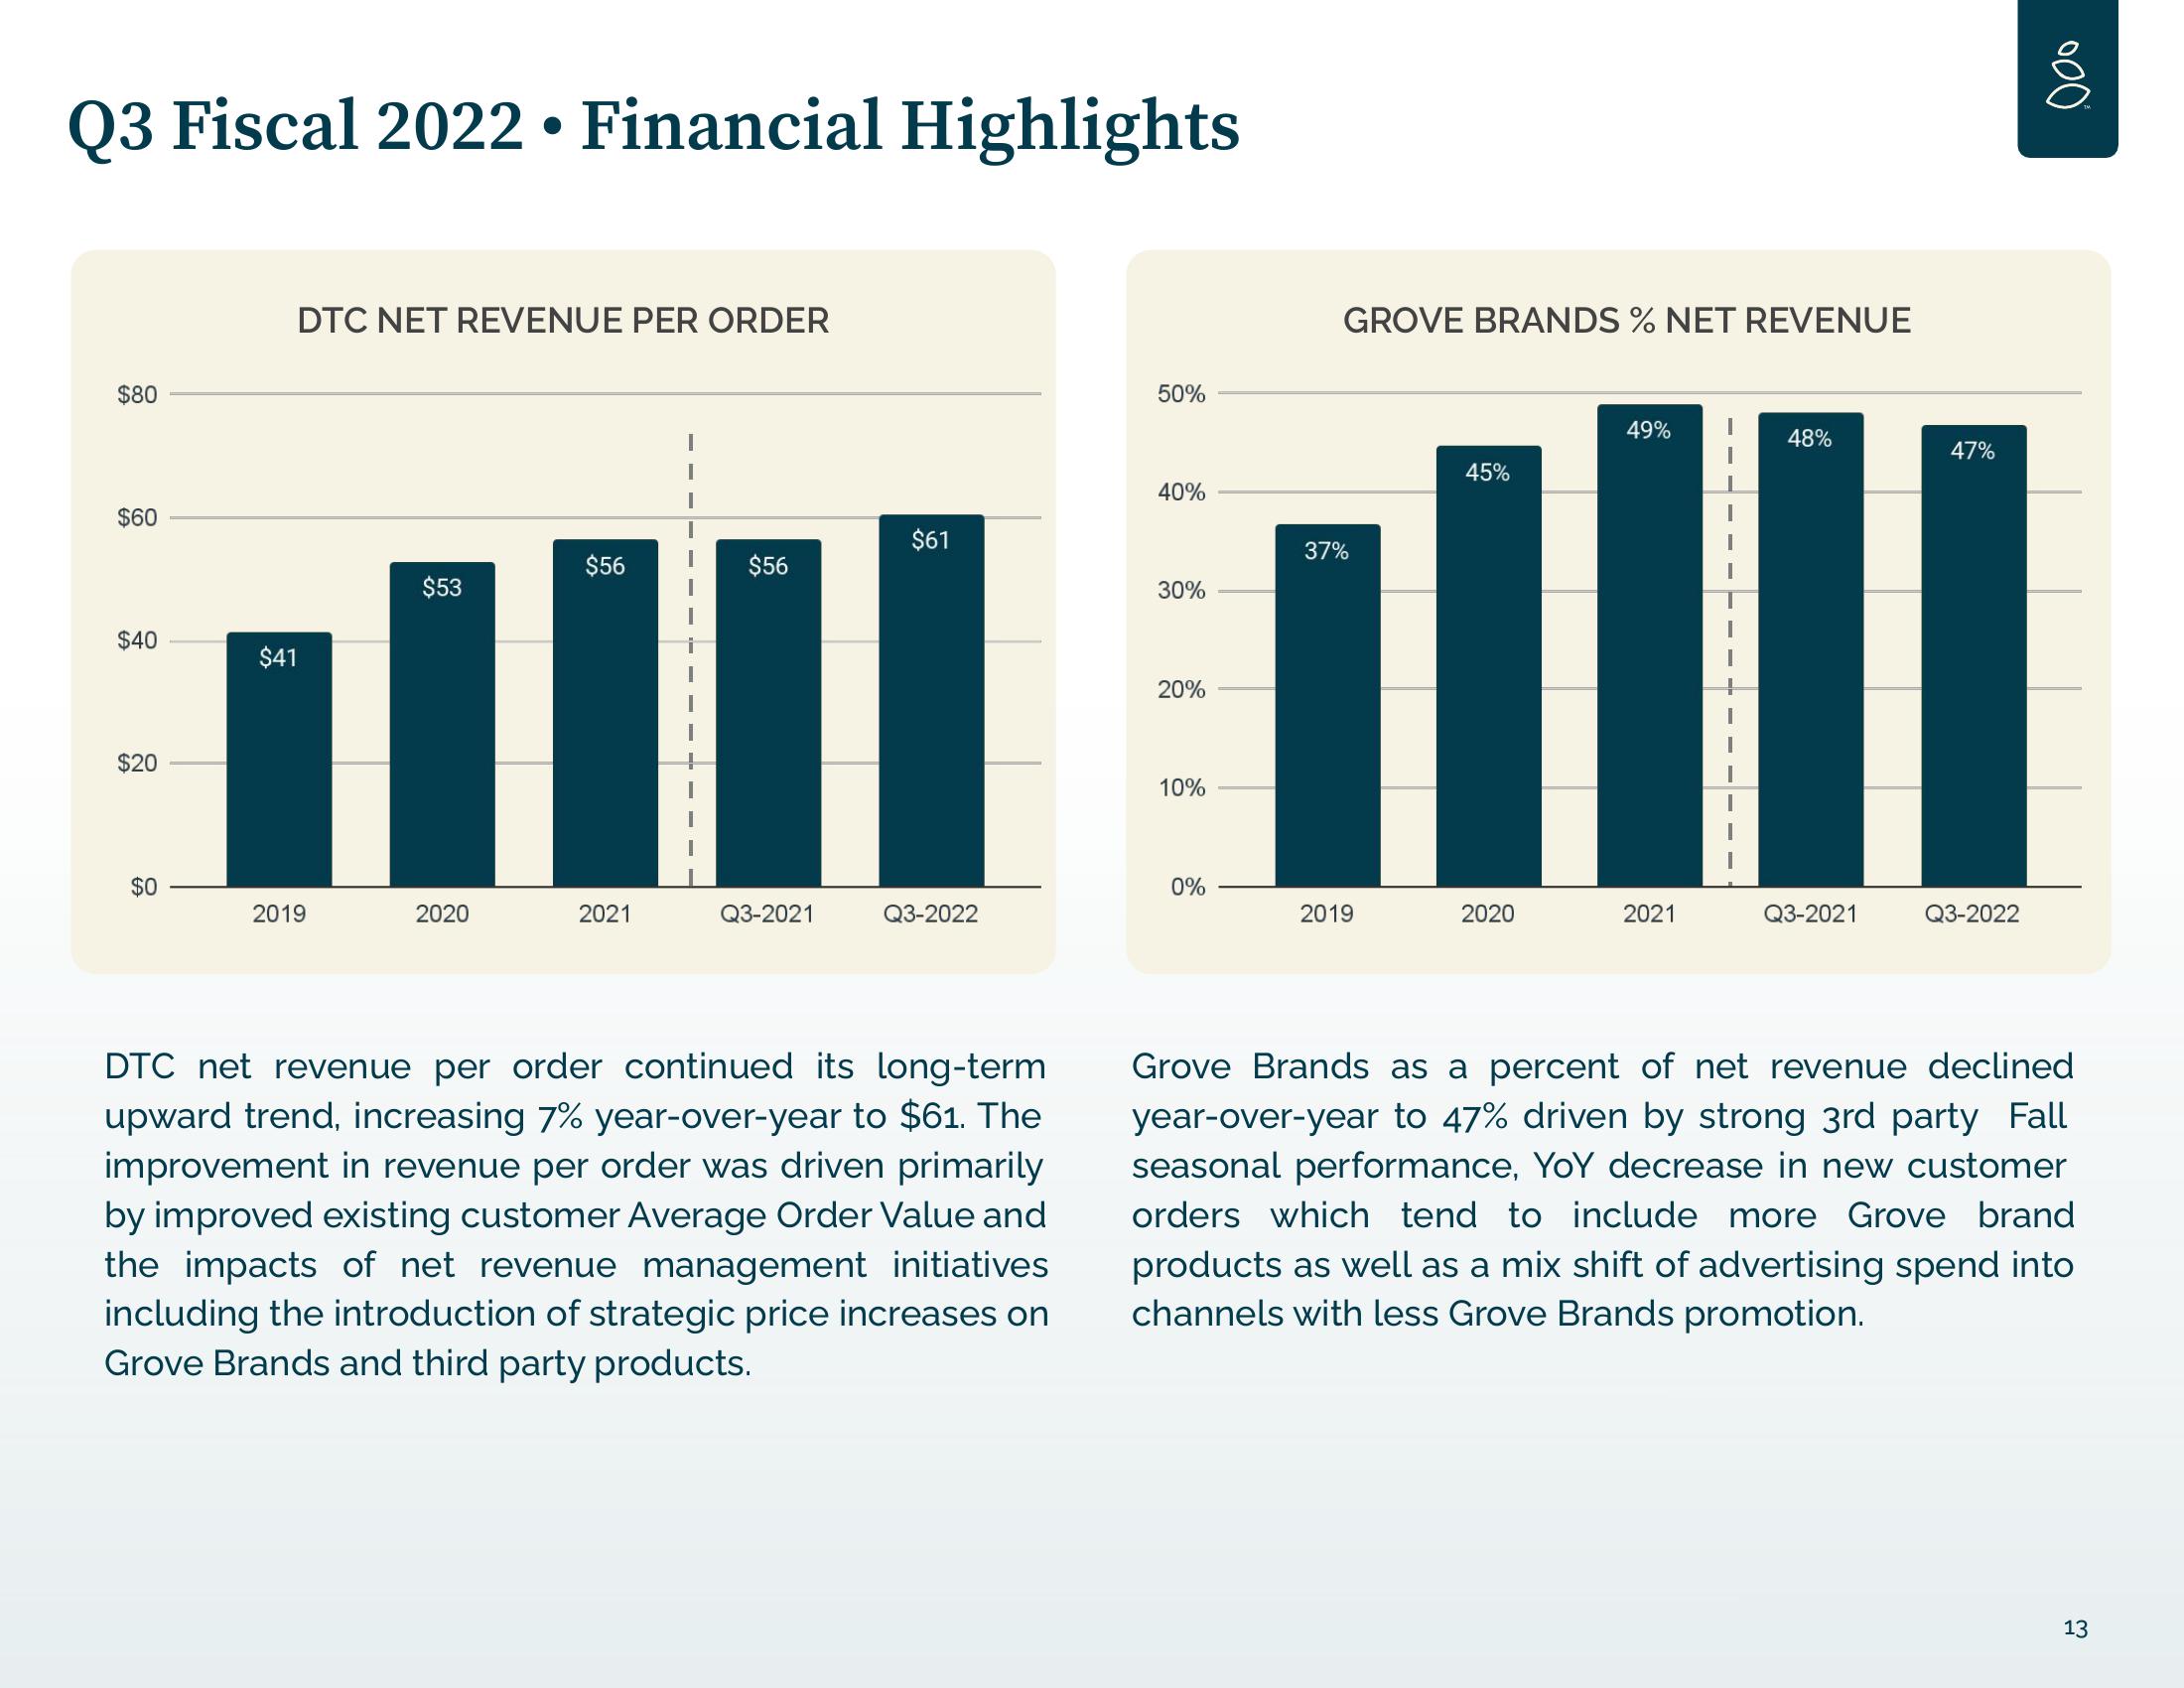
DTC net revenue per order continued its long-term
upward trend, increasing 7% year-over-year to $61. The
improvement in revenue per order was driven primarily
by improved existing customer Average Order Value and
the impacts of net revenue management initiatives
including the introduction of strategic price increases on
Grove Brands and third party products.
50%
40%
30%
20%
10%
0%
GROVE BRANDS % NET REVENUE
37%
2019
45%
2020
49%
2021
48%
Q3-2021
47%
Q3-2022
000
Grove Brands as a percent of net revenue declined
year-over-year to 47% driven by strong 3rd party Fall
seasonal performance, YoY decrease in new customer
orders which tend to include more Grove brand
products as well as a mix shift of advertising spend into
channels with less Grove Brands promotion.
13View entire presentation