AstraZeneca Results Presentation Deck
BioPharmaceuticals: Respiratory & Immunology
Total Revenue ($m)
450
400
350
300
250
200
150
100
50
ΠΕΜ
0
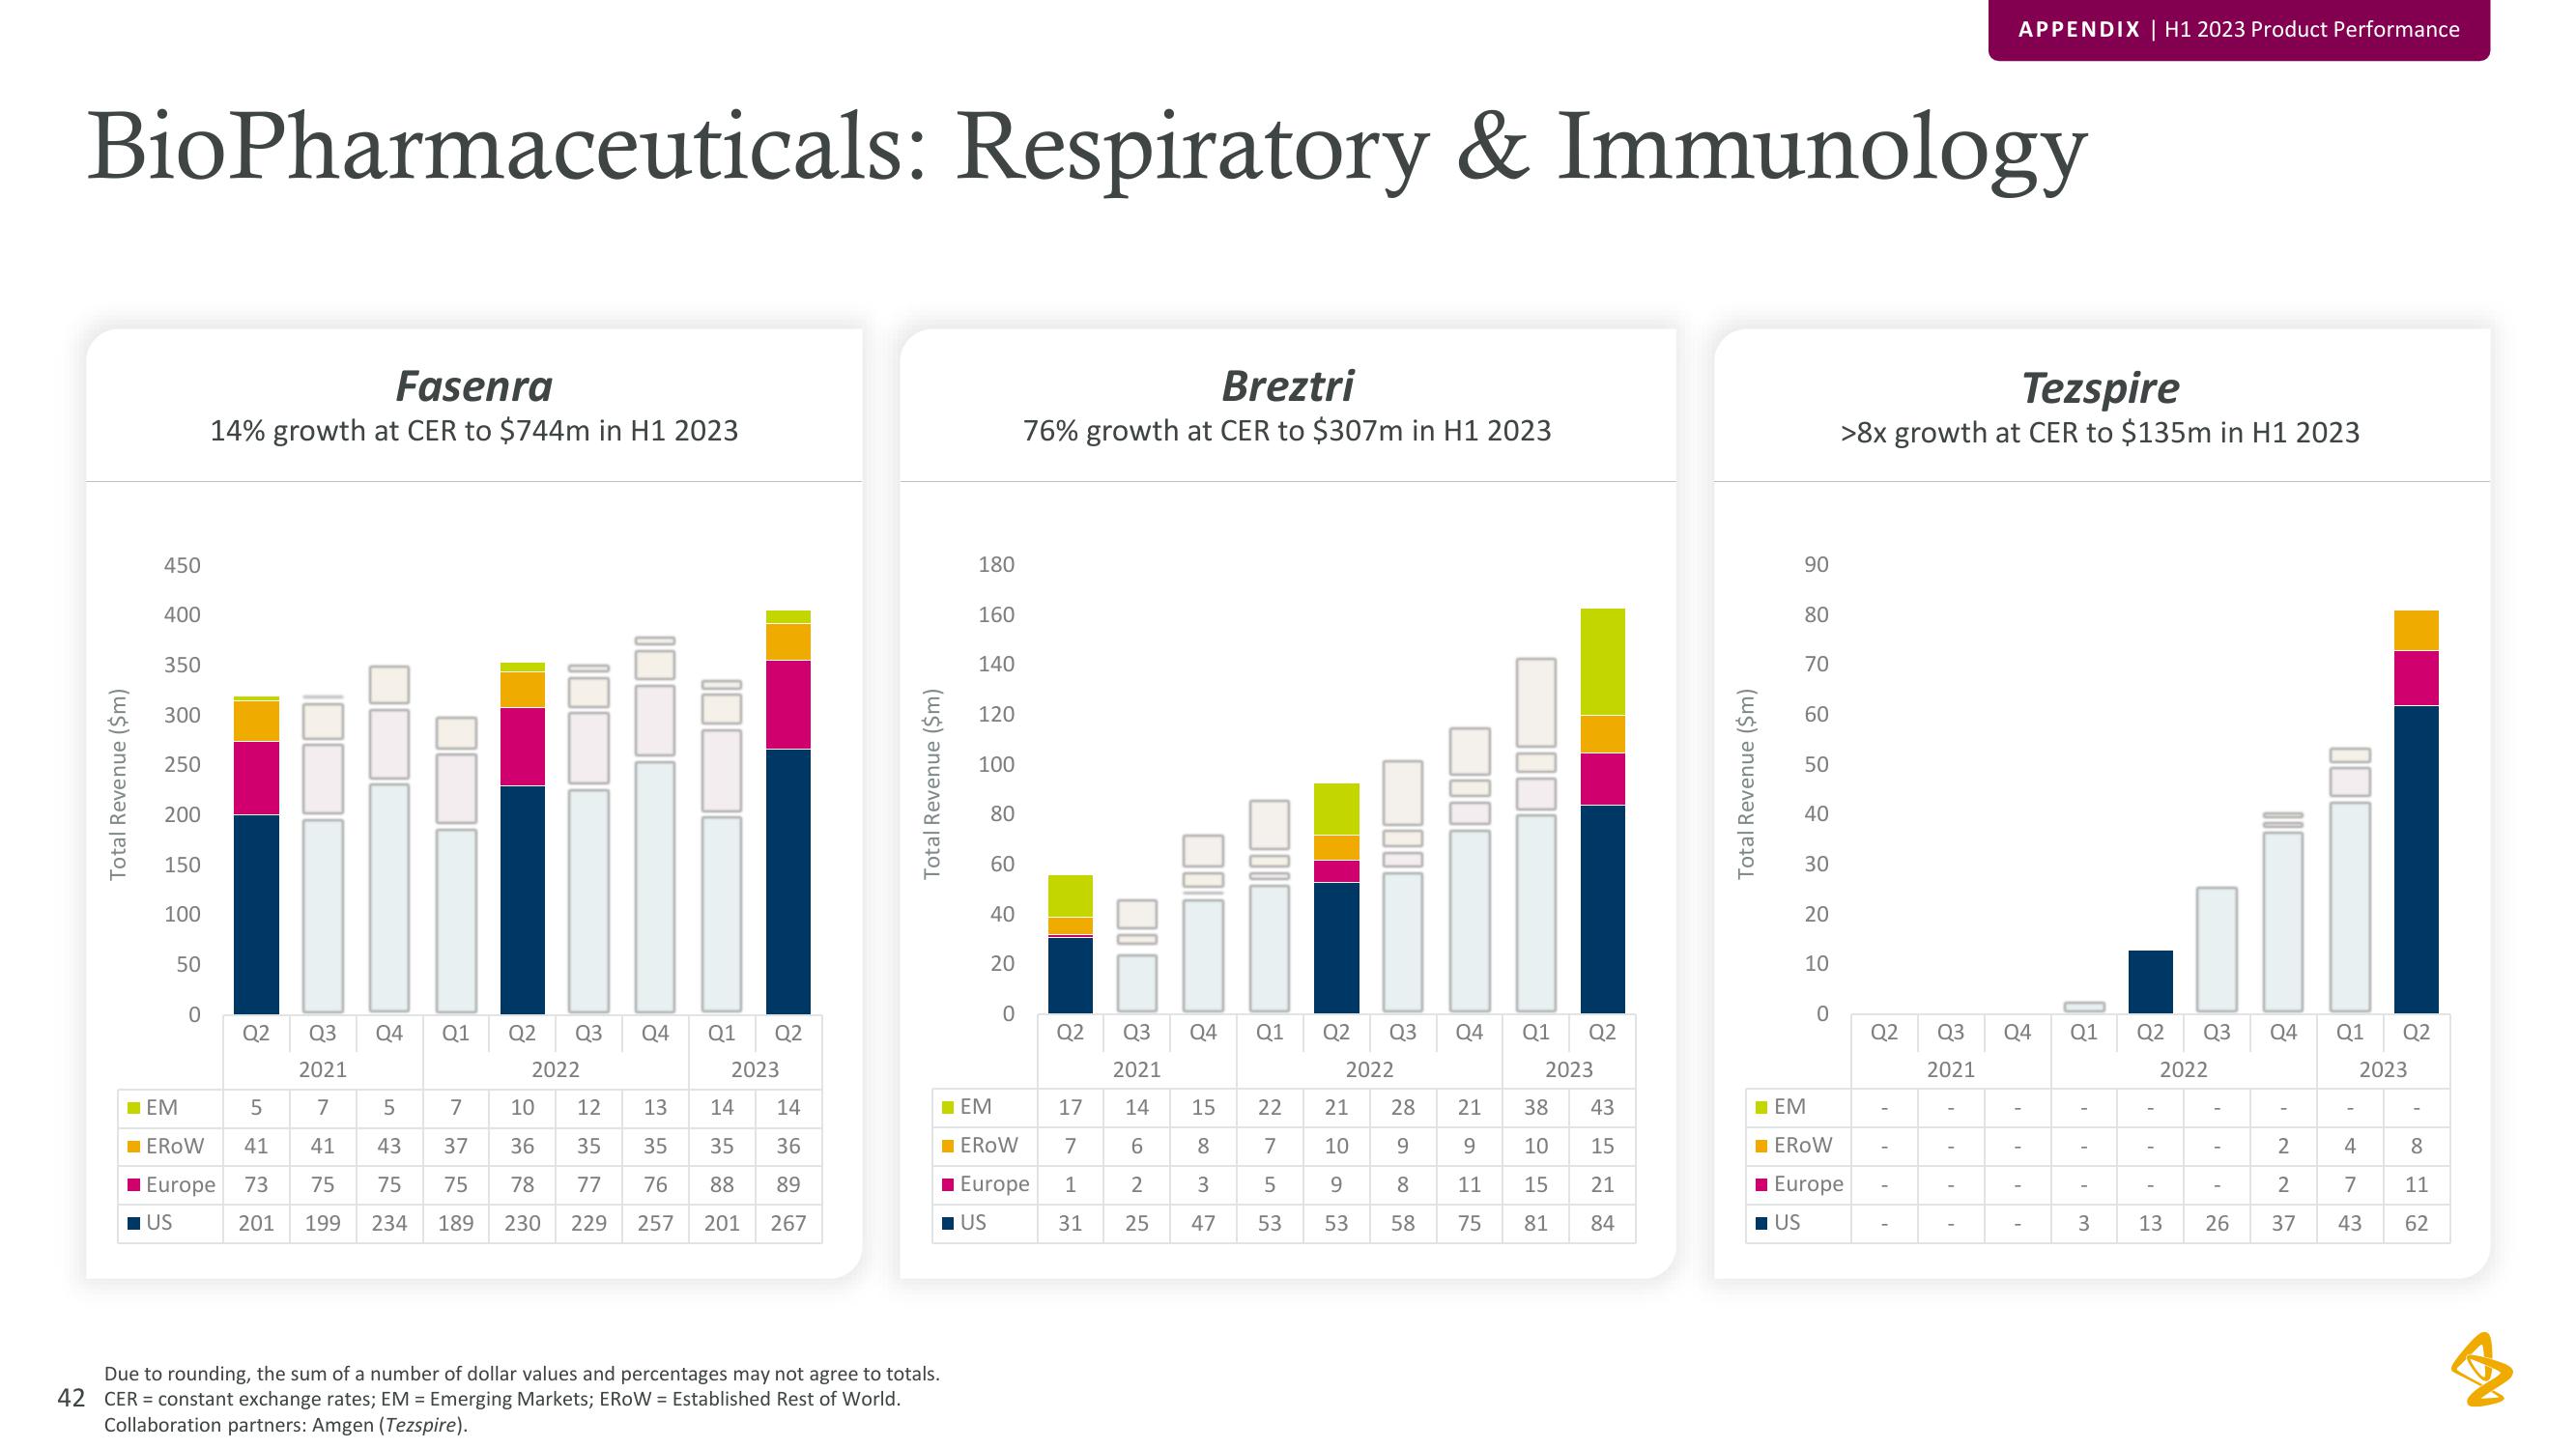
Fasenra
14% growth at CER to $744m in H1 2023
EROW
■ Europe
US
Q2 Q3
Q4 Q1
Q2
1.1.1
Q2 Q3 Q4 Q1 Q2 Q3 Q4 Q1 Q2
2021
14 15 22
6
8
7
2
3
5
25
47
53
Q3
2022
2021
5
7
5
7
10
12
41
41
43
37
36
35
73
75 75
75
78 77
201 199 234 189 230 229
Q4
Q1 Q2
2023
13.
14
14
35 35
36
76 88
89
257 201 267
180
160
Due to rounding, the sum of a number of dollar values and percentages may not agree to totals.
42 CER = constant exchange rates; EM = Emerging Markets; EROW= Established Rest of World.
Collaboration partners: Amgen (Tezspire).
140
120
100
80
60
40
20
0
☐EM
■EROW
Breztri
76% growth at CER to $307m in H1 2023
■ Europe
■US
17
7
1
31
2022
21
10
9
53
28 21
9
9
8
11
58
75
2023
38
10
15
81
43
15
21
84
90
80
70
60
50
40
30
20
10
0
Tezspire
>8x growth at CER to $135m in H1 2023
APPENDIX | H1 2023 Product Performance
☐EM
EROW
■ Europe
US
Q2 Q3 Q4 Q1 Q2 Q3 Q4 Q1
2021
T
1
1
1
1
i
2022
-
3 13 26
2
2
37
Q2
2023
4
7
43
8
11
62
BView entire presentation