Barclays 2023 Global Industrial Conference
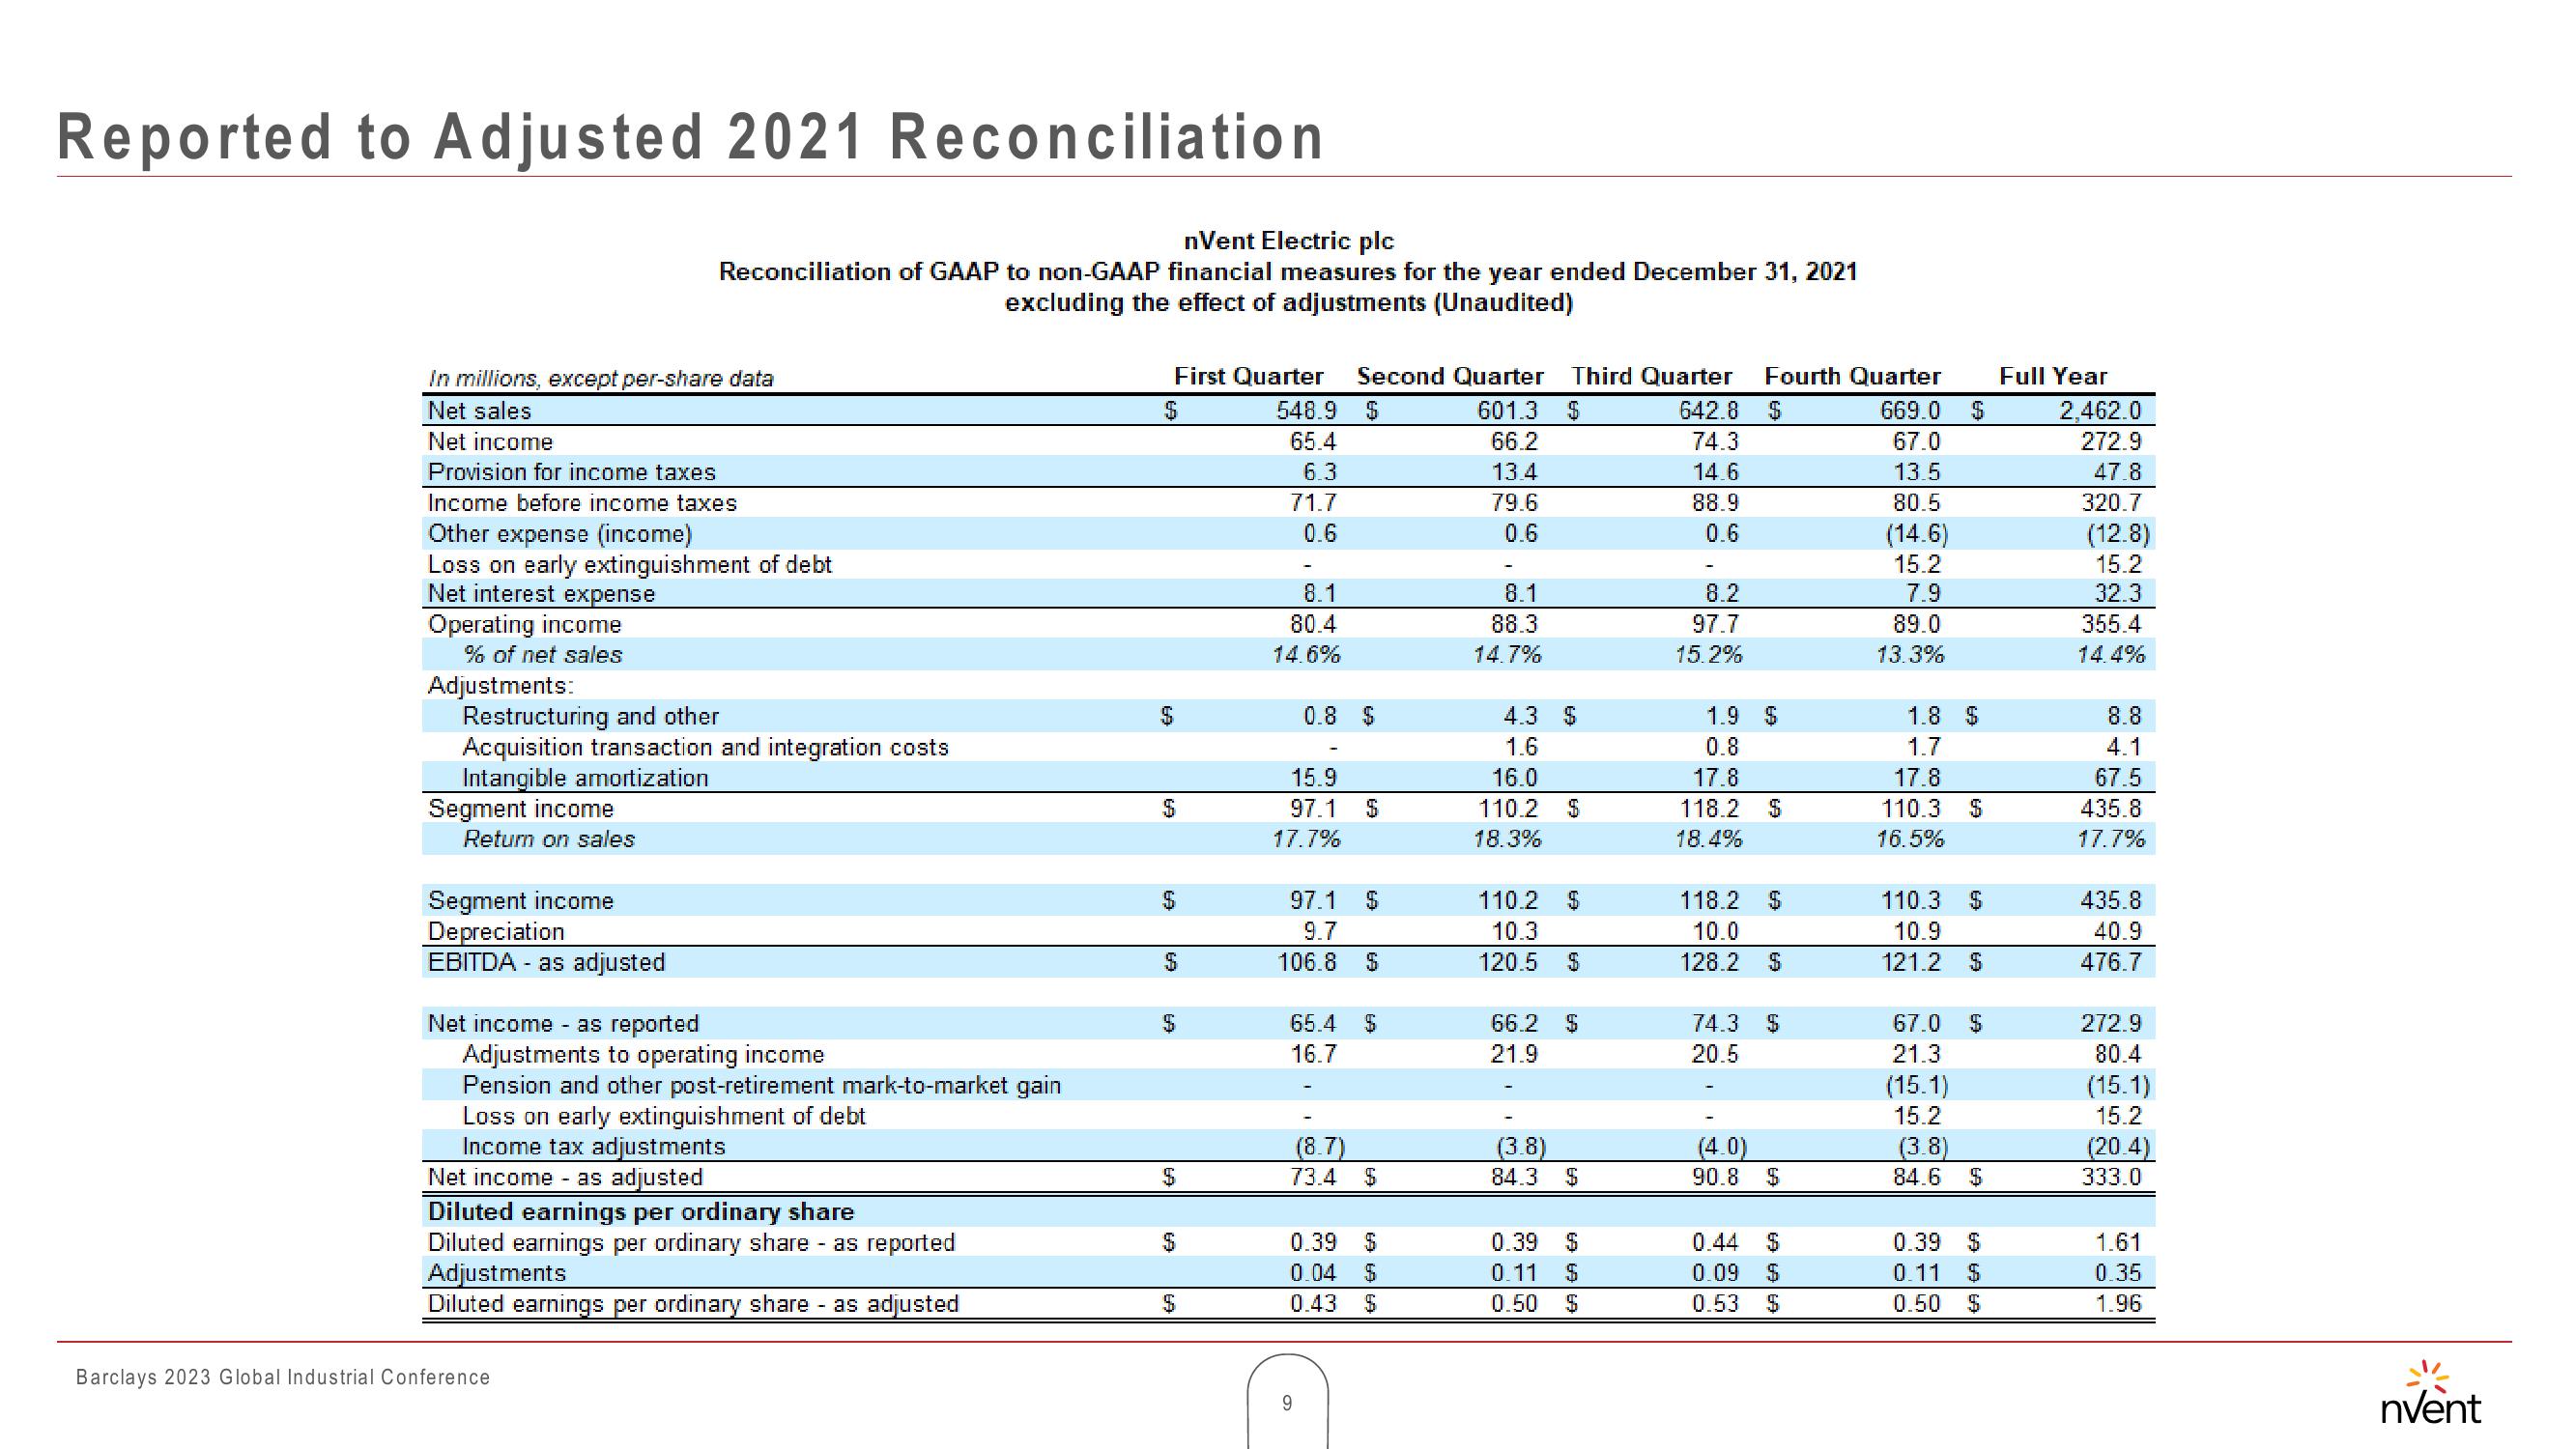
Reported to Adjusted 2021 Reconciliation
In millions, except per-share data
Net sales
Net income
Provision for income taxes
Income before income taxes
Other expense (income)
Loss on early extinguishment of debt
Net interest expense
Operating income
% of net sales
Adjustments:
Restructuring and other
Acquisition transaction and integration costs
Intangible amortization
Segment income
nVent Electric plc
Reconciliation of GAAP to non-GAAP financial measures for the year ended December 31, 2021
excluding the effect of adjustments (Unaudited)
Return on sales
Segment income
Depreciation
EBITDA as adjusted
Net income as reported
Adjustments to operating income
Pension and other post-retirement mark-to-market gain
Loss on early extinguishment of debt
Income tax adjustments
Net income as adjusted
Diluted earnings per ordinary share
Diluted earnings per ordinary share - as reported
Adjustments
Diluted earnings per ordinary share - as adjusted
Barclays 2023 Global Industrial Conference
$
First Quarter
548.9
65.4
6.3
71.7
0.6
69
69
69
69
$
$
$
$
8.1
80.4
14.6%
15.9
97.1
17.7%
0.8 $
65.4
16.7
97.1 $
9.7
106.8
(8.7)
73.4
Second Quarter Third Quarter
$
601.3 $
642.8
74.3
14.6
66.2
13.4
79.6
88.9
0.6
0.6
0.39
0.04
0.43
9
69
69
$
$
69 69 69
8.1
88.3
14.7%
4.3 $
1.6
16.0
110.2
18.3%
110.2 S
10.3
120.5
66.2
21.9
(3.8)
84.3
69
0.39
0.11
0.50
69
69
$
69 69 69
$
8.2
97.7
15.2%
1.9 S
0.8
17.8
118.2
18.4%
118.2
10.0
128.2
74.3
20.5
(4.0)
90.8
Fourth Quarter
$
669.0
67.0
13.5
80.5
(14.6)
15.2
7.9
89.0
13.3%
0.44
0.09
0.53
69
69
69
69
69
69 69 69
1.8 $
1.7
17.8
110.3
16.5%
$
69
0.39
0.11
0.50
110.3
10.9
121.2 S
69
67.0
21.3
(15.1)
15.2
(3.8)
84.6 $
69
69 69 69
Full Year
2,462.0
272.9
47.8
320.7
(12.8)
15.2
32.3
355.4
14.4%
+00
8.8
4.1
67.5
435.8
17.7%
435.8
40.9
476.7
272.9
80.4
(15.1)
15.2
(20.4)
333.0
1.61
0.35
1.96
nventView entire presentation