Carlyle Investor Day Presentation Deck
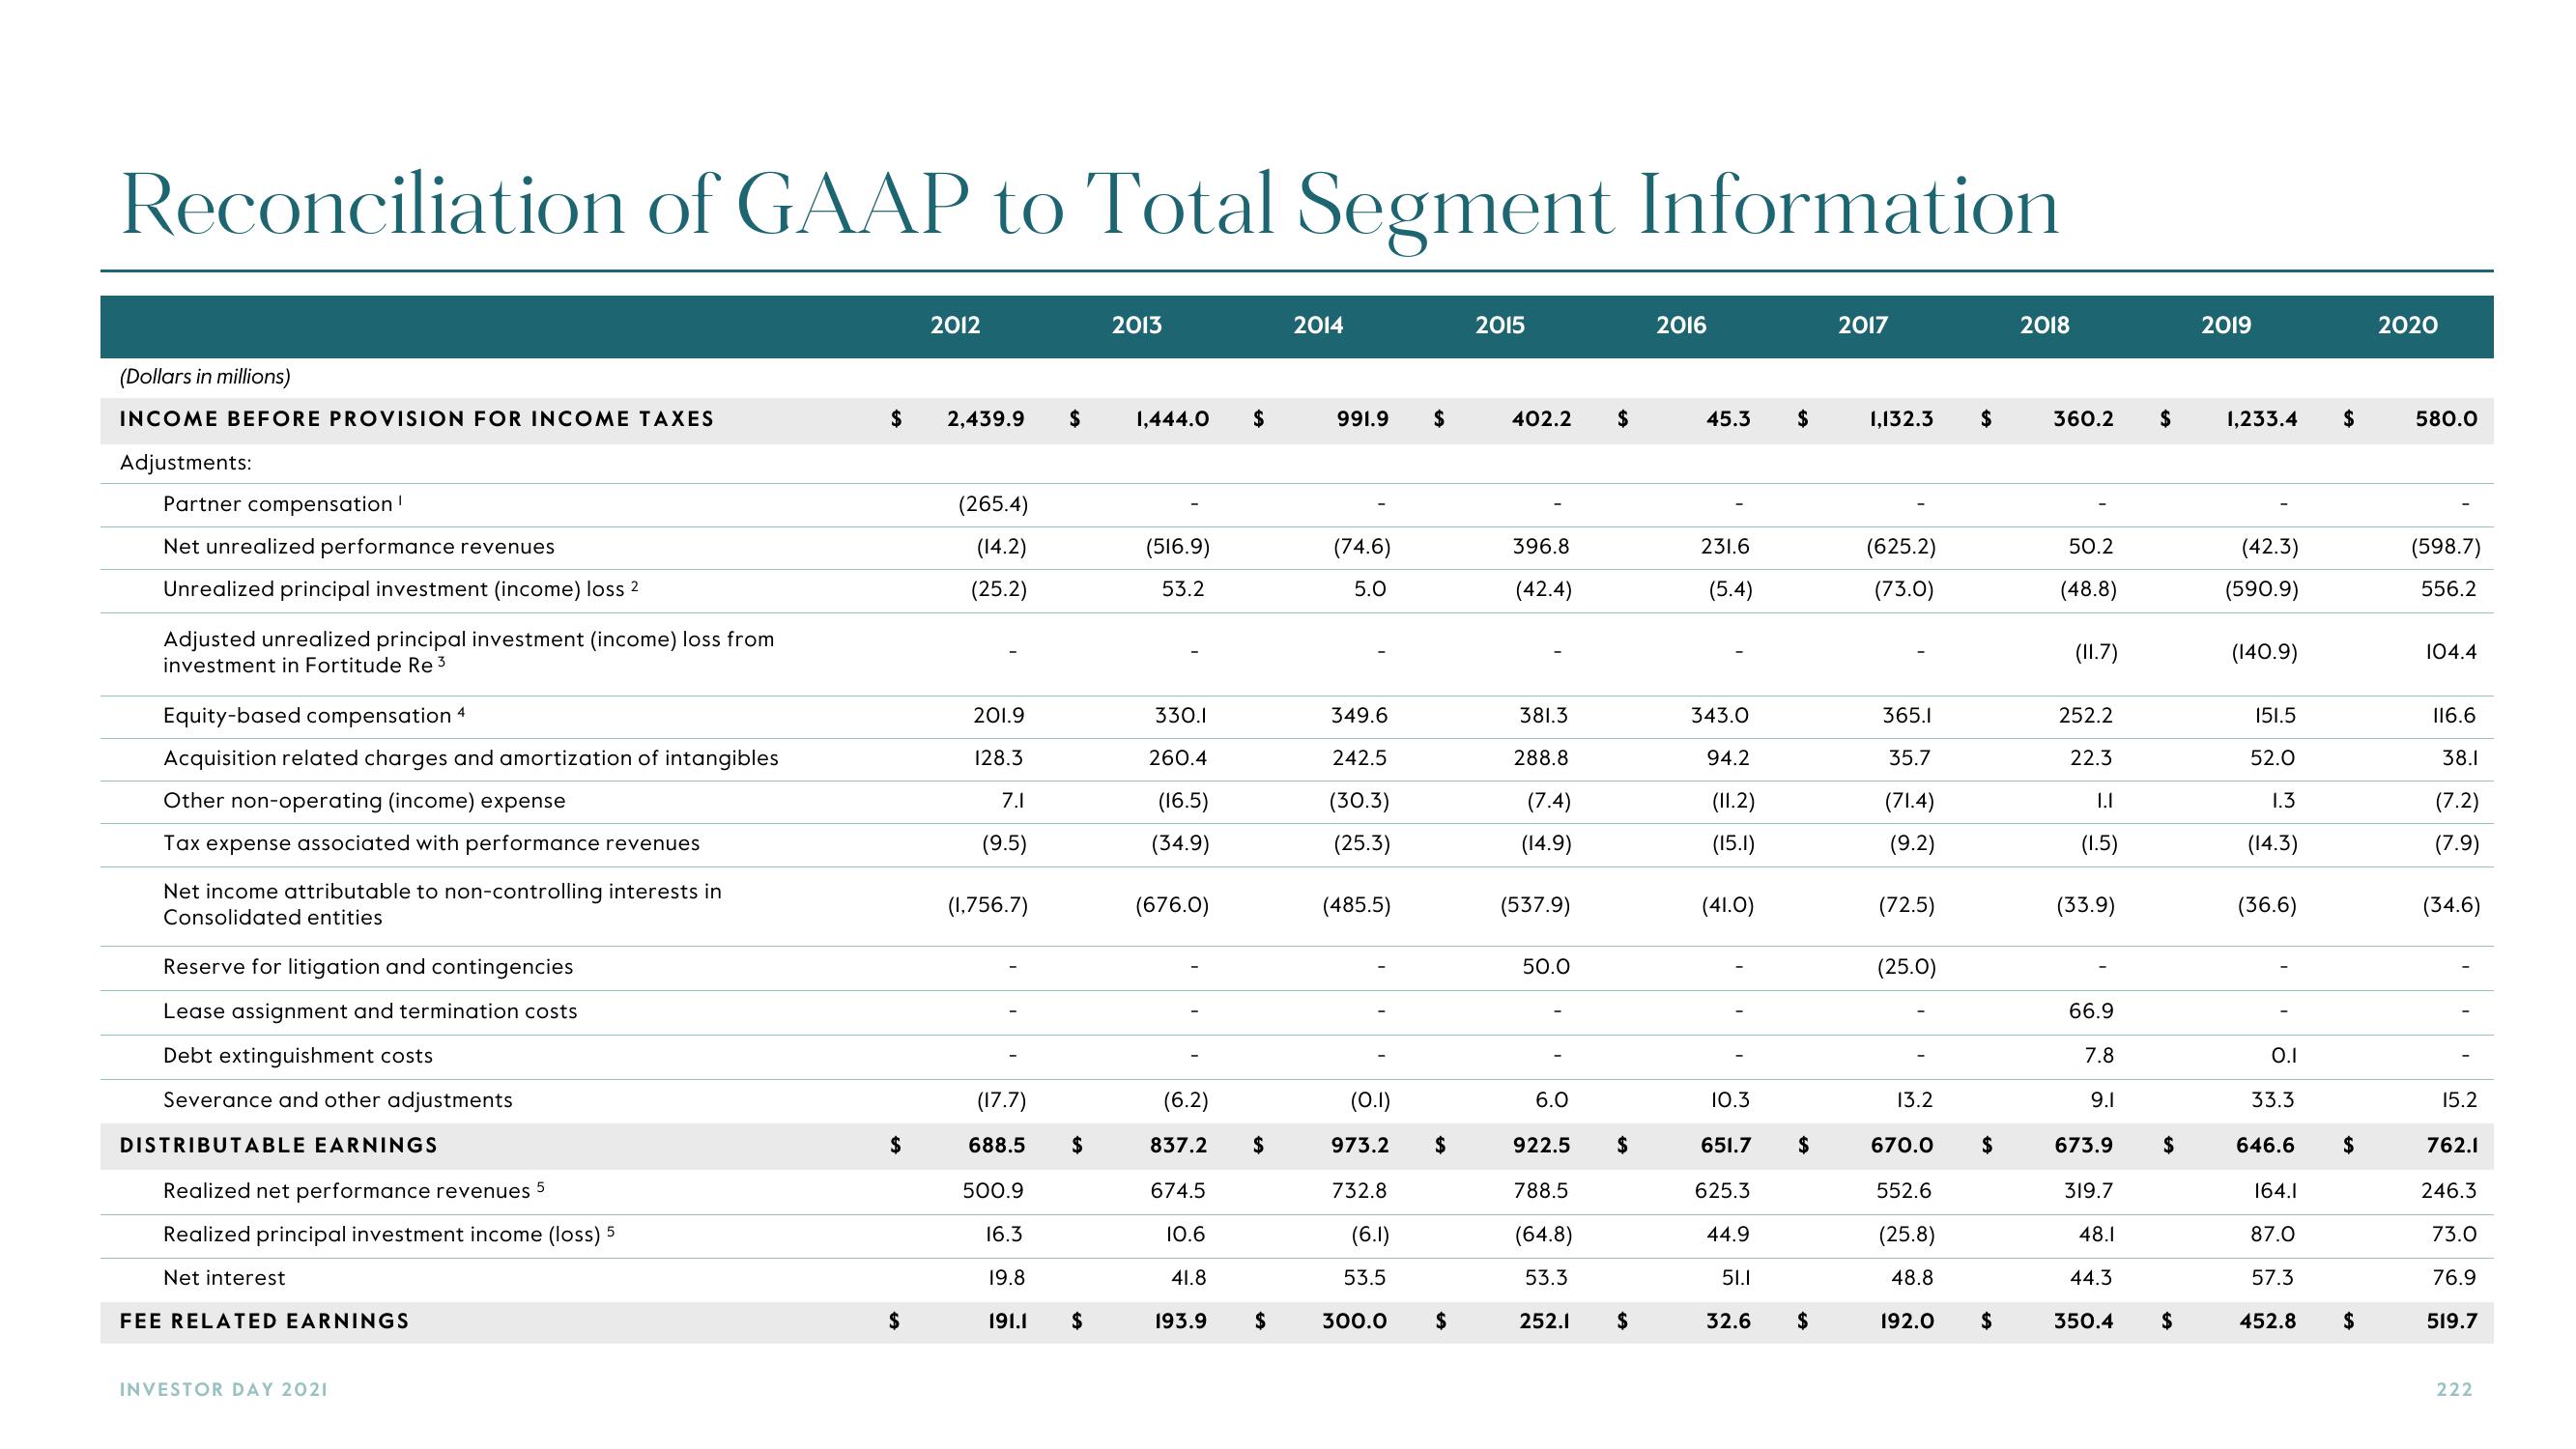
Reconciliation of GAAP to Total Segment Information
(Dollars in millions)
INCOME BEFORE PROVISION FOR INCOME TAXES
Adjustments:
Partner compensation!
Net unrealized performance revenues
Unrealized principal investment (income) loss 2
Adjusted unrealized principal investment (income) loss from
investment in Fortitude Re 3
Equity-based compensation 4
Acquisition related charges and amortization of intangibles
Other non-operating (income) expense
Tax expense associated with performance revenues
Net income attributable to non-controlling interests in
Consolidated entities
Reserve for litigation and contingencies
Lease assignment and termination costs
Debt extinguishment costs
Severance and other adjustments
DISTRIBUTABLE EARNINGS
Realized net performance revenues 5
Realized principal investment income (loss) 5
Net interest
FEE RELATED EARNINGS
INVESTOR DAY 2021
$
$
2012
2,439.9
(265.4)
(14.2)
(25.2)
201.9
128.3
7.1
(9.5)
(1,756.7)
(17.7)
688.5
500.9
16.3
19.8
191.1
$
$
2013
1,444.0
(516.9)
53.2
330.1
260.4
(16.5)
(34.9)
(676.0)
(6.2)
837.2
674.5
10.6
41.8
193.9
$
$
2014
991.9 $
(74.6)
5.0
349.6
242.5
(30.3)
(25.3)
(485.5)
(0.1)
973.2
732.8
(6.1)
53.5
300.0
$
$
2015
402.2 $
396.8
(42.4)
381.3
288.8
(7.4)
(537.9)
50.0
6.0
922.5
788.5
(64.8)
53.3
252.1
$
$
2016
45.3 $
231.6
(5.4)
343.0
94.2
(11.2)
(15.1)
(41.0)
10.3
651.7
625.3
44.9
51.1
32.6
$
$
2017
1,132.3 $
(625.2)
(73.0)
365.1
35.7
(71.4)
(9.2)
(72.5)
(25.0)
13.2
670.0
552.6
(25.8)
48.8
192.0
$
2018
360.2 $
50.2
(48.8)
(11.7)
252.2
22.3
I.I
(1.5)
(33.9)
66.9
7.8
9.1
673.9
319.7
48.1
44.3
350.4
$
$
2019
1,233.4 $
(42.3)
(590.9)
(140.9)
151.5
52.0
1.3
(14.3)
(36.6)
O.I
33.3
646.6
164.1
87.0
57.3
452.8
$
$
2020
580.0
(598.7)
556.2
104.4
116.6
38.1
(7.2)
(7.9)
(34.6)
15.2
762.1
246.3
73.0
76.9
519.7
222View entire presentation