Affirm Results Presentation Deck
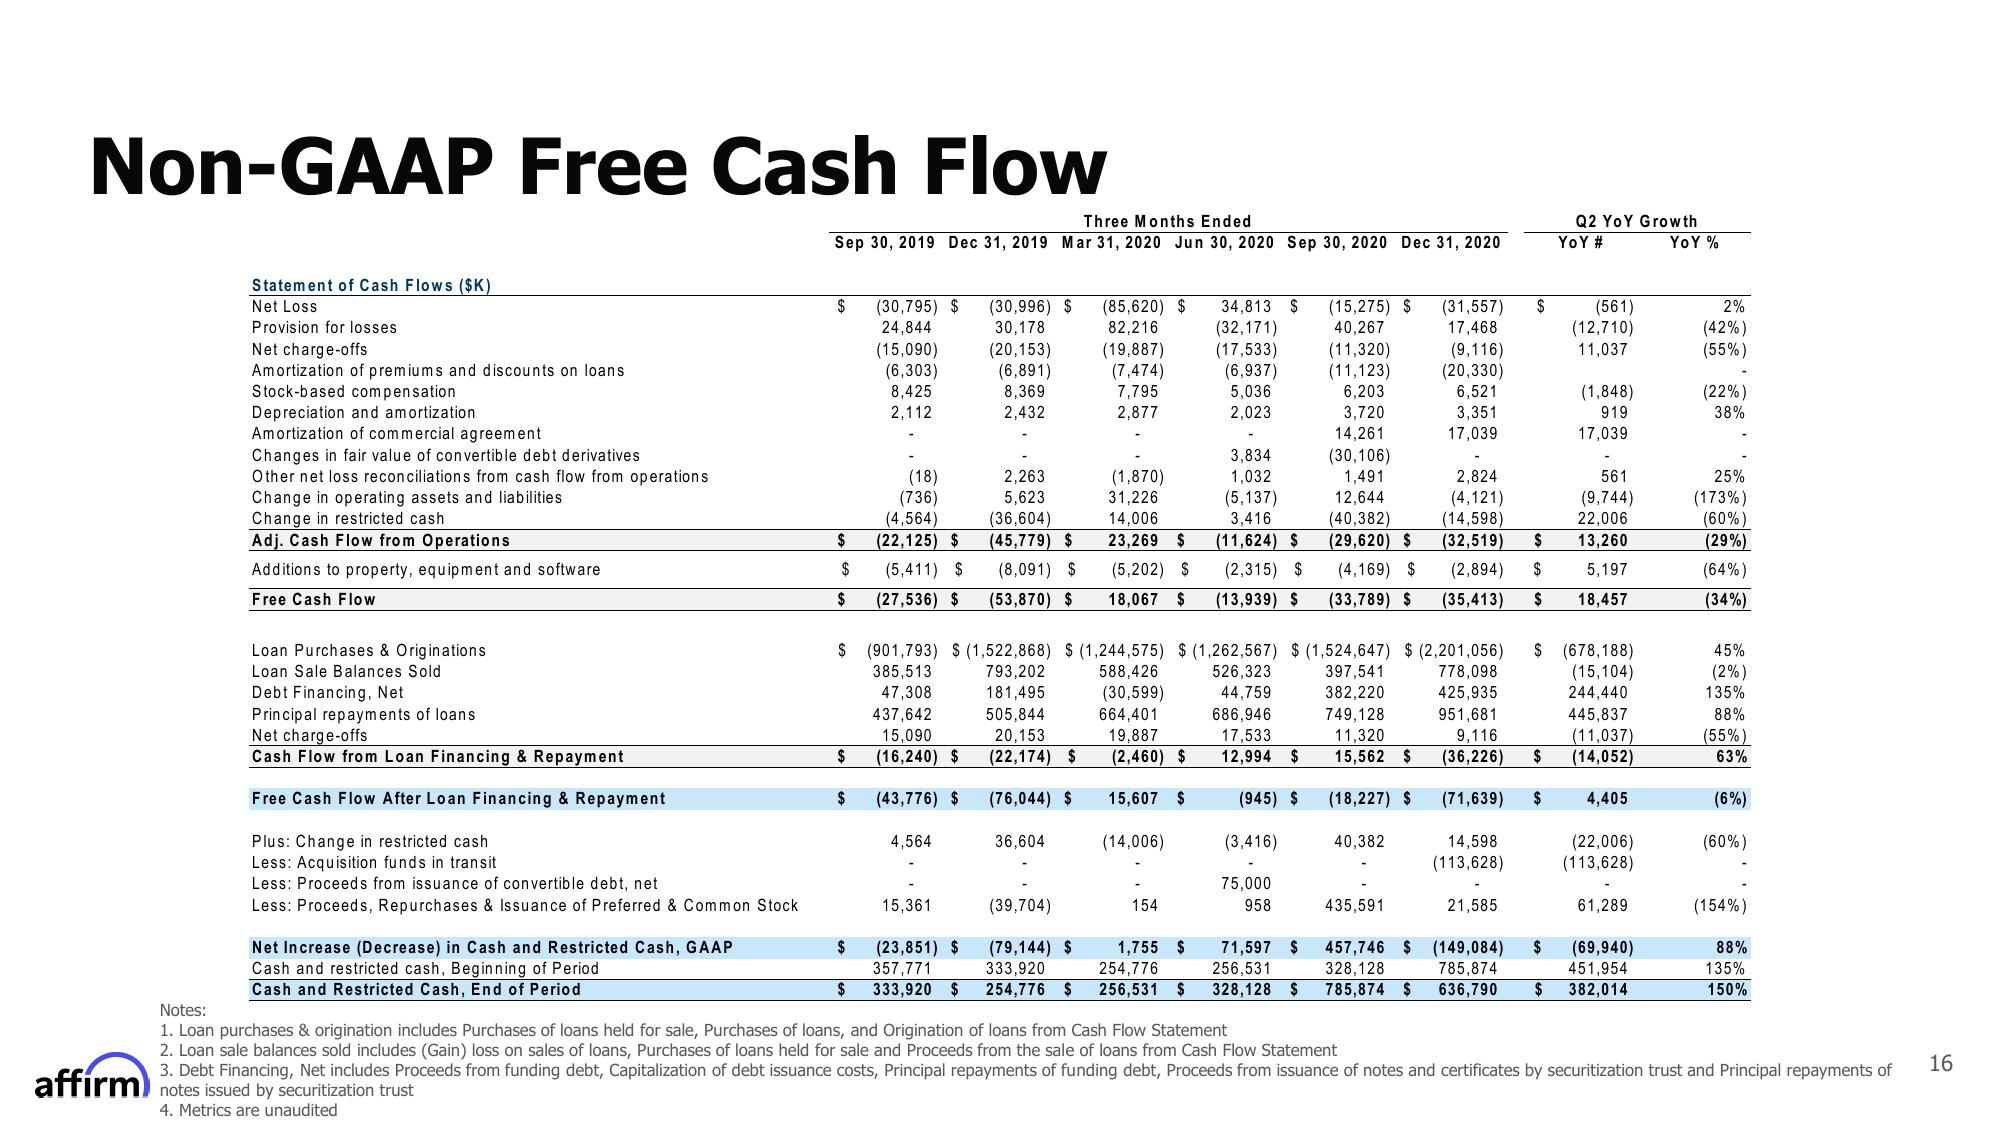
Non-GAAP Free Cash Flow
Statement of Cash Flows ($K)
Net Loss
Provision for losses
Net charge-offs
Amortization of premiums and discounts on loans
Stock-based compensation
Depreciation and amortization
Amortization of commercial agreement
Changes in fair value of convertible debt derivatives
Other net loss reconciliations from cash flow from operations
Change in operating assets and liabilities.
Change in restricted cash
Adj. Cash Flow from Operations
Additions to property, equipment and software
Free Cash Flow
Loan Purchases & Originations
Loan Sale Balances Sold
Debt Financing, Net
Principal repayments of loans
Net charge-offs
Cash Flow from Loan Financing & Repayment
Free Cash Flow After Loan Financing & Repayment
Plus: Change in restricted cash
Less: Acquisition funds in transit
Less: Proceeds from issuance of convertible debt, net
Less: Proceeds, Repurchases & Issuance of Preferred & Common Stock
Net Increase (Decrease) in Cash and Restricted Cash, GAAP
Cash and restricted cash, Beginning of Period
Cash and Restricted Cash, End of Period
Three Months Ended
Sep 30, 2019 Dec 31, 2019 Mar 31, 2020 Jun 30, 2020 Sep 30, 2020 Dec 31, 2020
$ (30,795) $
24,844
(15,090)
(6,303)
8,425
2,112
$
$
$
$
$
$
(18)
(736)
(4,564)
(22,125) $
(5,411) $
(27,536) $
$
437,642
15,090
(16,240) $
(43,776) $
4,564
15,361
(30,996) $ (85,620) $
30,178
82,216
(20,153) (19,887)
(6,891) (7,474)
8,369
7,795
2,432
2.877
$ (901,793) $ (1,522,868) $ (1,244,575) $ (1,262,567) $ (1,524,647) $ (2,201,056)
385,513
793,202
588,426
526,323
397,541
778,098
47,308
181,495
382,220
425,935
505,844
20,153
(22,174) $
44,759
686,946
17,533
12,994 $
(945) $
(3,416)
75,000
958
749,128
11,320
15,562 $
(18,227) $
951,681
9,116
(36,226) $
(71,639) $
(76,044) $
(23,851) $
357,771
333,920 $
2,263
5,623
(36,604)
(45,779) $
(8,091) $
(53,870) $
(1,870)
31,226
14,006
23,269 $
(5,202) $
18,067 $
36,604
(30,599)
664,401
19,887
(2,460) $
15,607 $
(14,006)
154
34,813 $
(32,171)
(17,533)
(6,937)
5,036
2,023
(39,704)
(79,144) $ 1,755 $
333,920 254,776
254,776 $ 256,531 $
3,834
1,032
(5,137)
3,416
(11,624) $
(2,315) $
(13,939) $
(15,275) $ (31,557)
40,267
(11,320)
17,468
(9,116)
(20,330)
(11,123)
6,203
3,720
6,521
3,351
17,039
14,261
(30,106)
1,491
12,644
(40,382)
(29,620) $
(4,169) $
(33,789) $
71,597 $
256,531
328,128 S
40,382
435,591
$
14,598
(113,628)
21,585
Q2 YoY Growth
YOY %
YOY #
561
(9,744)
22,006
2,824
(4,121)
(14,598)
(32,519) $ 13,260
(2,894) $ 5,197
(35,413) $ 18,457
(561)
(12,710)
11,037
(1,848)
919
17,039
$ (678,188)
(15,104)
244,440
445,837
(11,037)
(14,052)
4,405
(22,006)
(113,628)
61,289
457,746 $ (149,084) $ (69,940)
328,128 785,874
451,954
785,874 $ 636,790 $ 382,014
2%
(42%)
(55%)
(22%)
38%
25%
(173%)
(60%)
(29%)
(64%)
(34%)
45%
(2%)
135%
88%
(55%)
63%
(6%)
(60%)
(154%)
88%
135%
150%
Notes:
1. Loan purchases & origination includes Purchases of loans held for sale, Purchases of loans, and Origination of loans from Cash Flow Statement
2. Loan sale balances sold includes (Gain) loss on sales of loans, Purchases of loans held for sale and Proceeds from the sale of loans from Cash Flow Statement
3. Debt Financing, Net includes Proceeds from funding debt, Capitalization of debt issuance costs, Principal repayments of funding debt, Proceeds from issuance of notes and certificates by securitization trust and Principal repayments of
notes issued by securitization trust
affirm)
4. Metrics are unaudited
16View entire presentation