Investor Presentation slide image

Investor Presentation

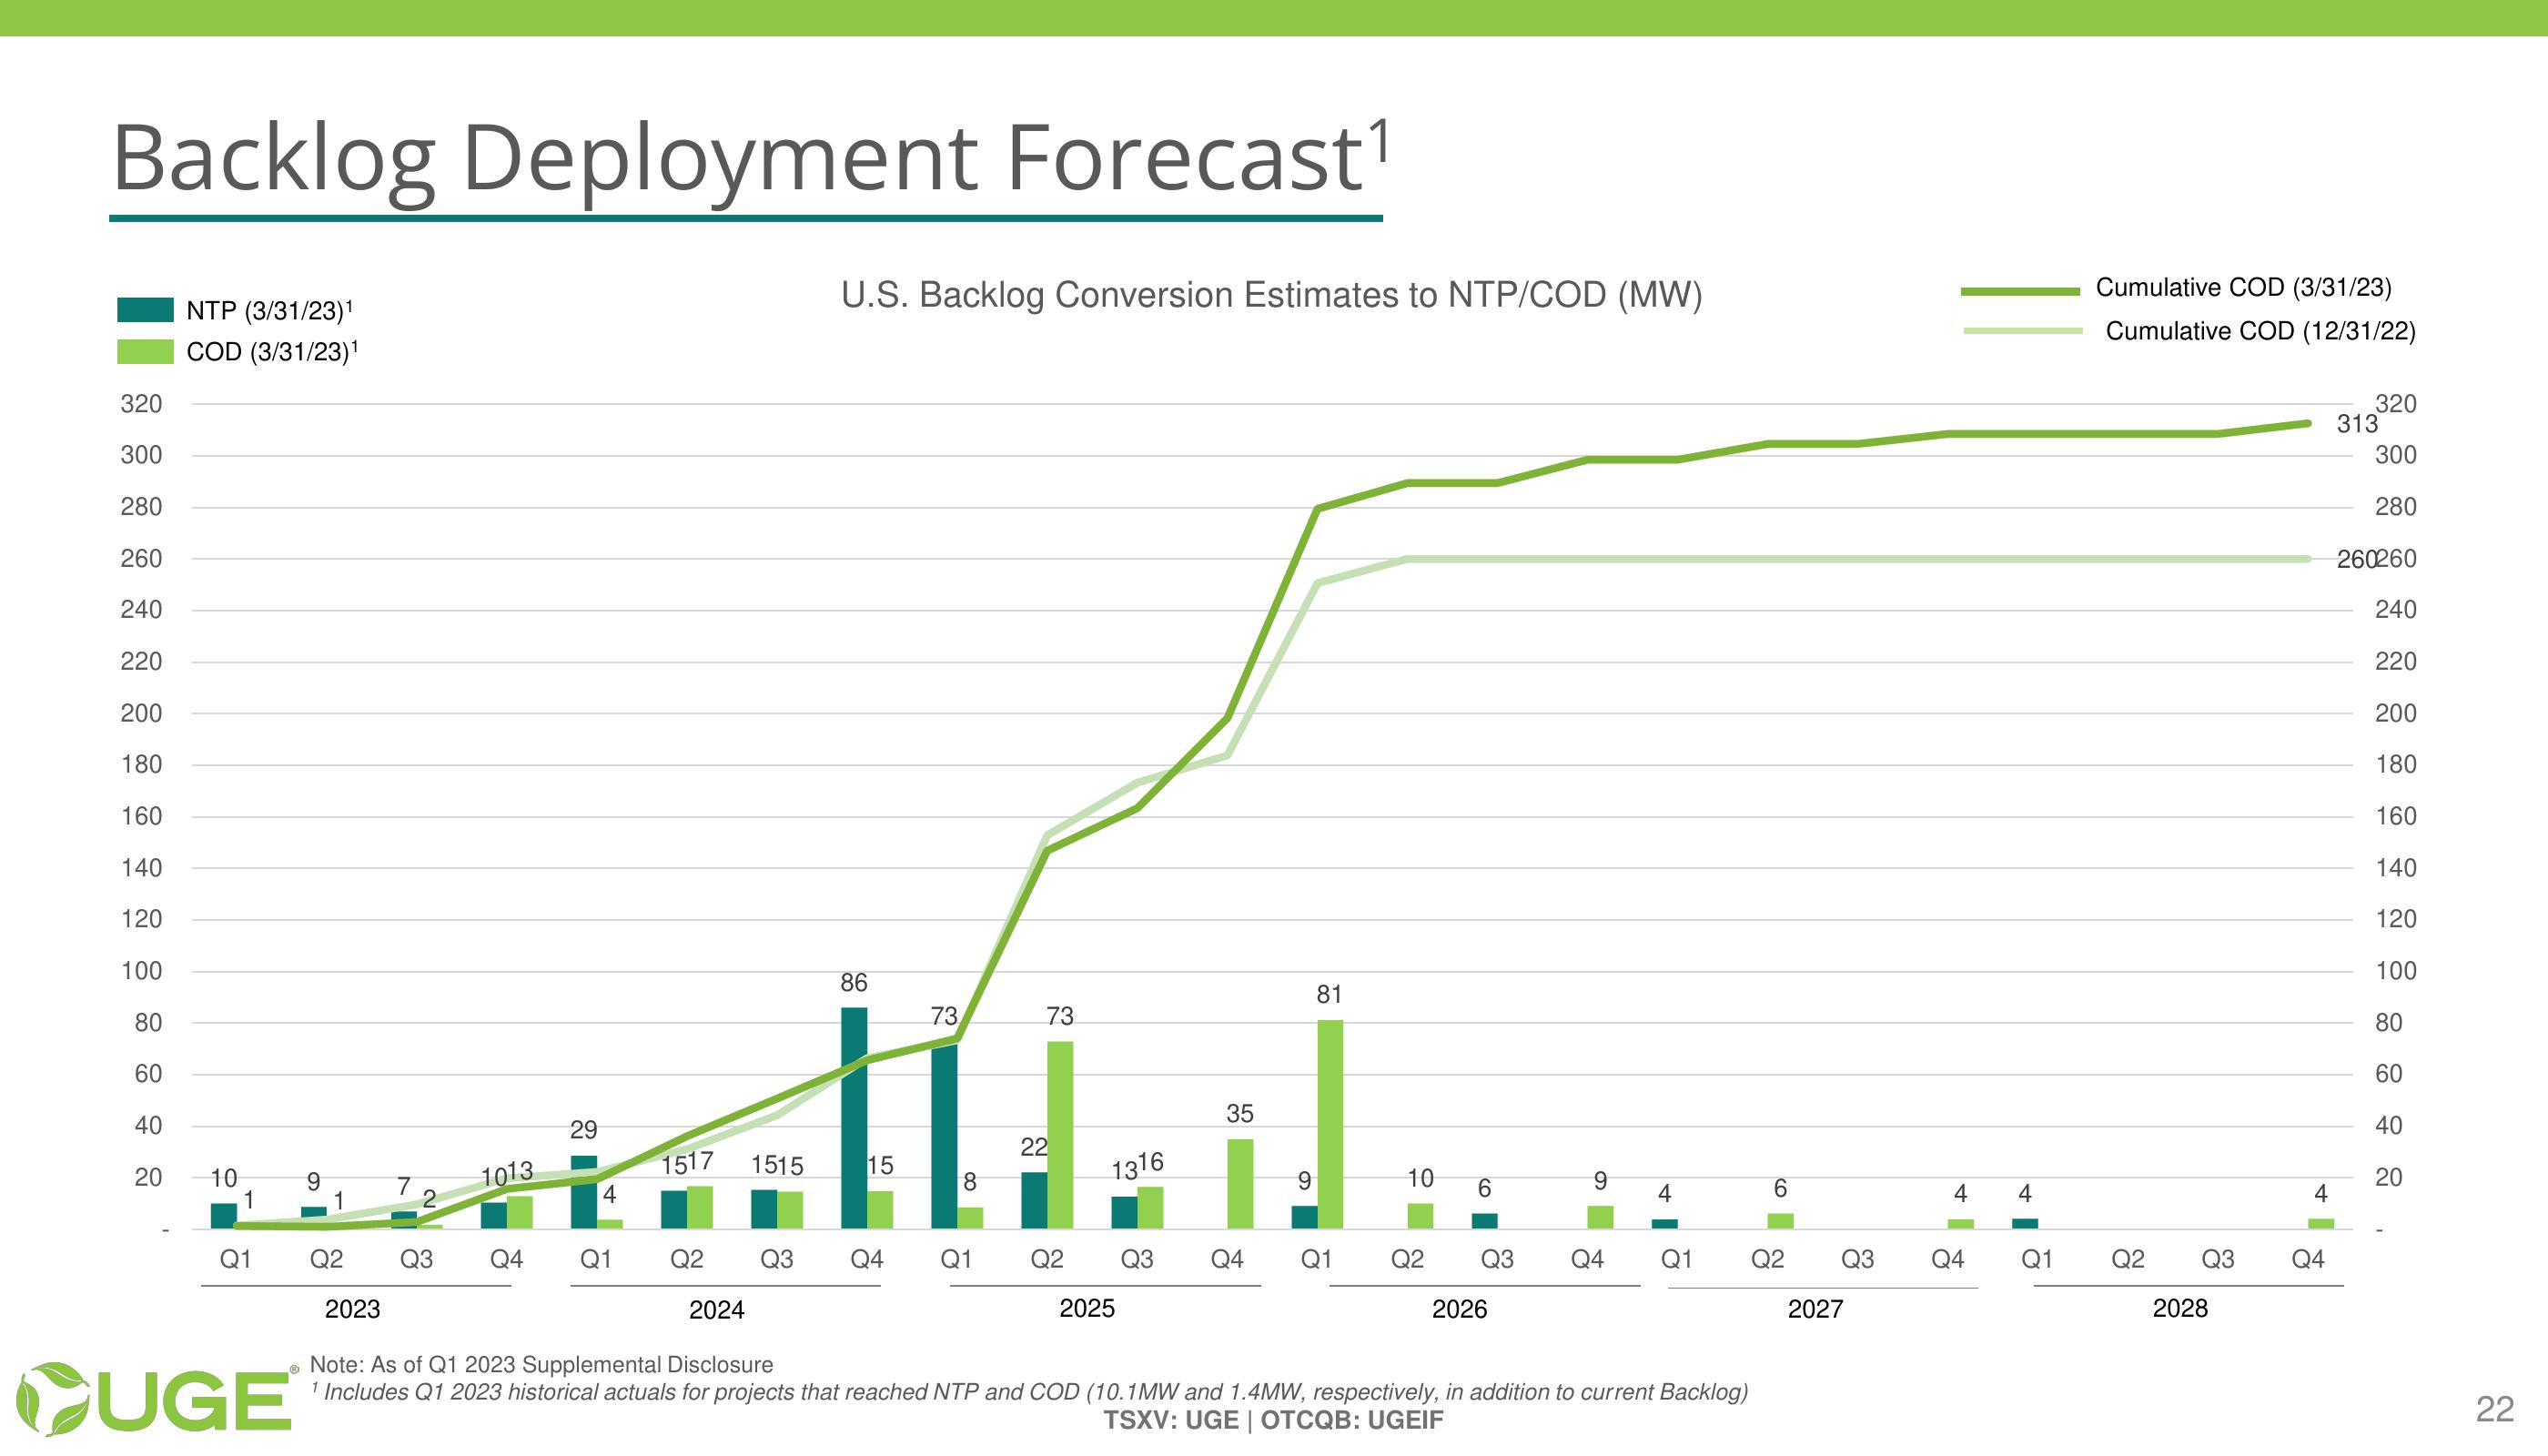
Backlog Deployment Forecast¹ 320 NTP (3/31/23)1 COD (3/31/23)1 U.S. Backlog Conversion Estimates to NTP/COD (MW) Cumulative COD (3/31/23) Cumulative COD (12/31/22) 320 313 300 280 260260 240 220 200 180 160 140 120 100 40 20 4 882 80 60 300 280 260 240 220 200 180 160 140 120 100 80 86 73 73 81 60 35 40 29 22 20 10 9 1013 1517 1515 15 1316 8 9 10 1 1 2 4 6 9 4 6 4 4 Q1 Q2 Q3 Q4 Q1 Q2 Q3 Q4 Q1 Q2 Q3 Q4 Q1 Q2 Q3 Q4 Q1 Q2 Q3 Q4 Q1 Q2 Q3 Q4 2023 2024 2025 2026 2027 2028 UGE Note: As of Q1 2023 Supplemental Disclosure 1 Includes Q1 2023 historical actuals for projects that reached NTP and COD (10.1MW and 1.4MW, respectively, in addition to current Backlog) TSXV: UGE | OTCQB: UGEIF 22 22
View entire presentation