Evercore Investment Banking Pitch Book
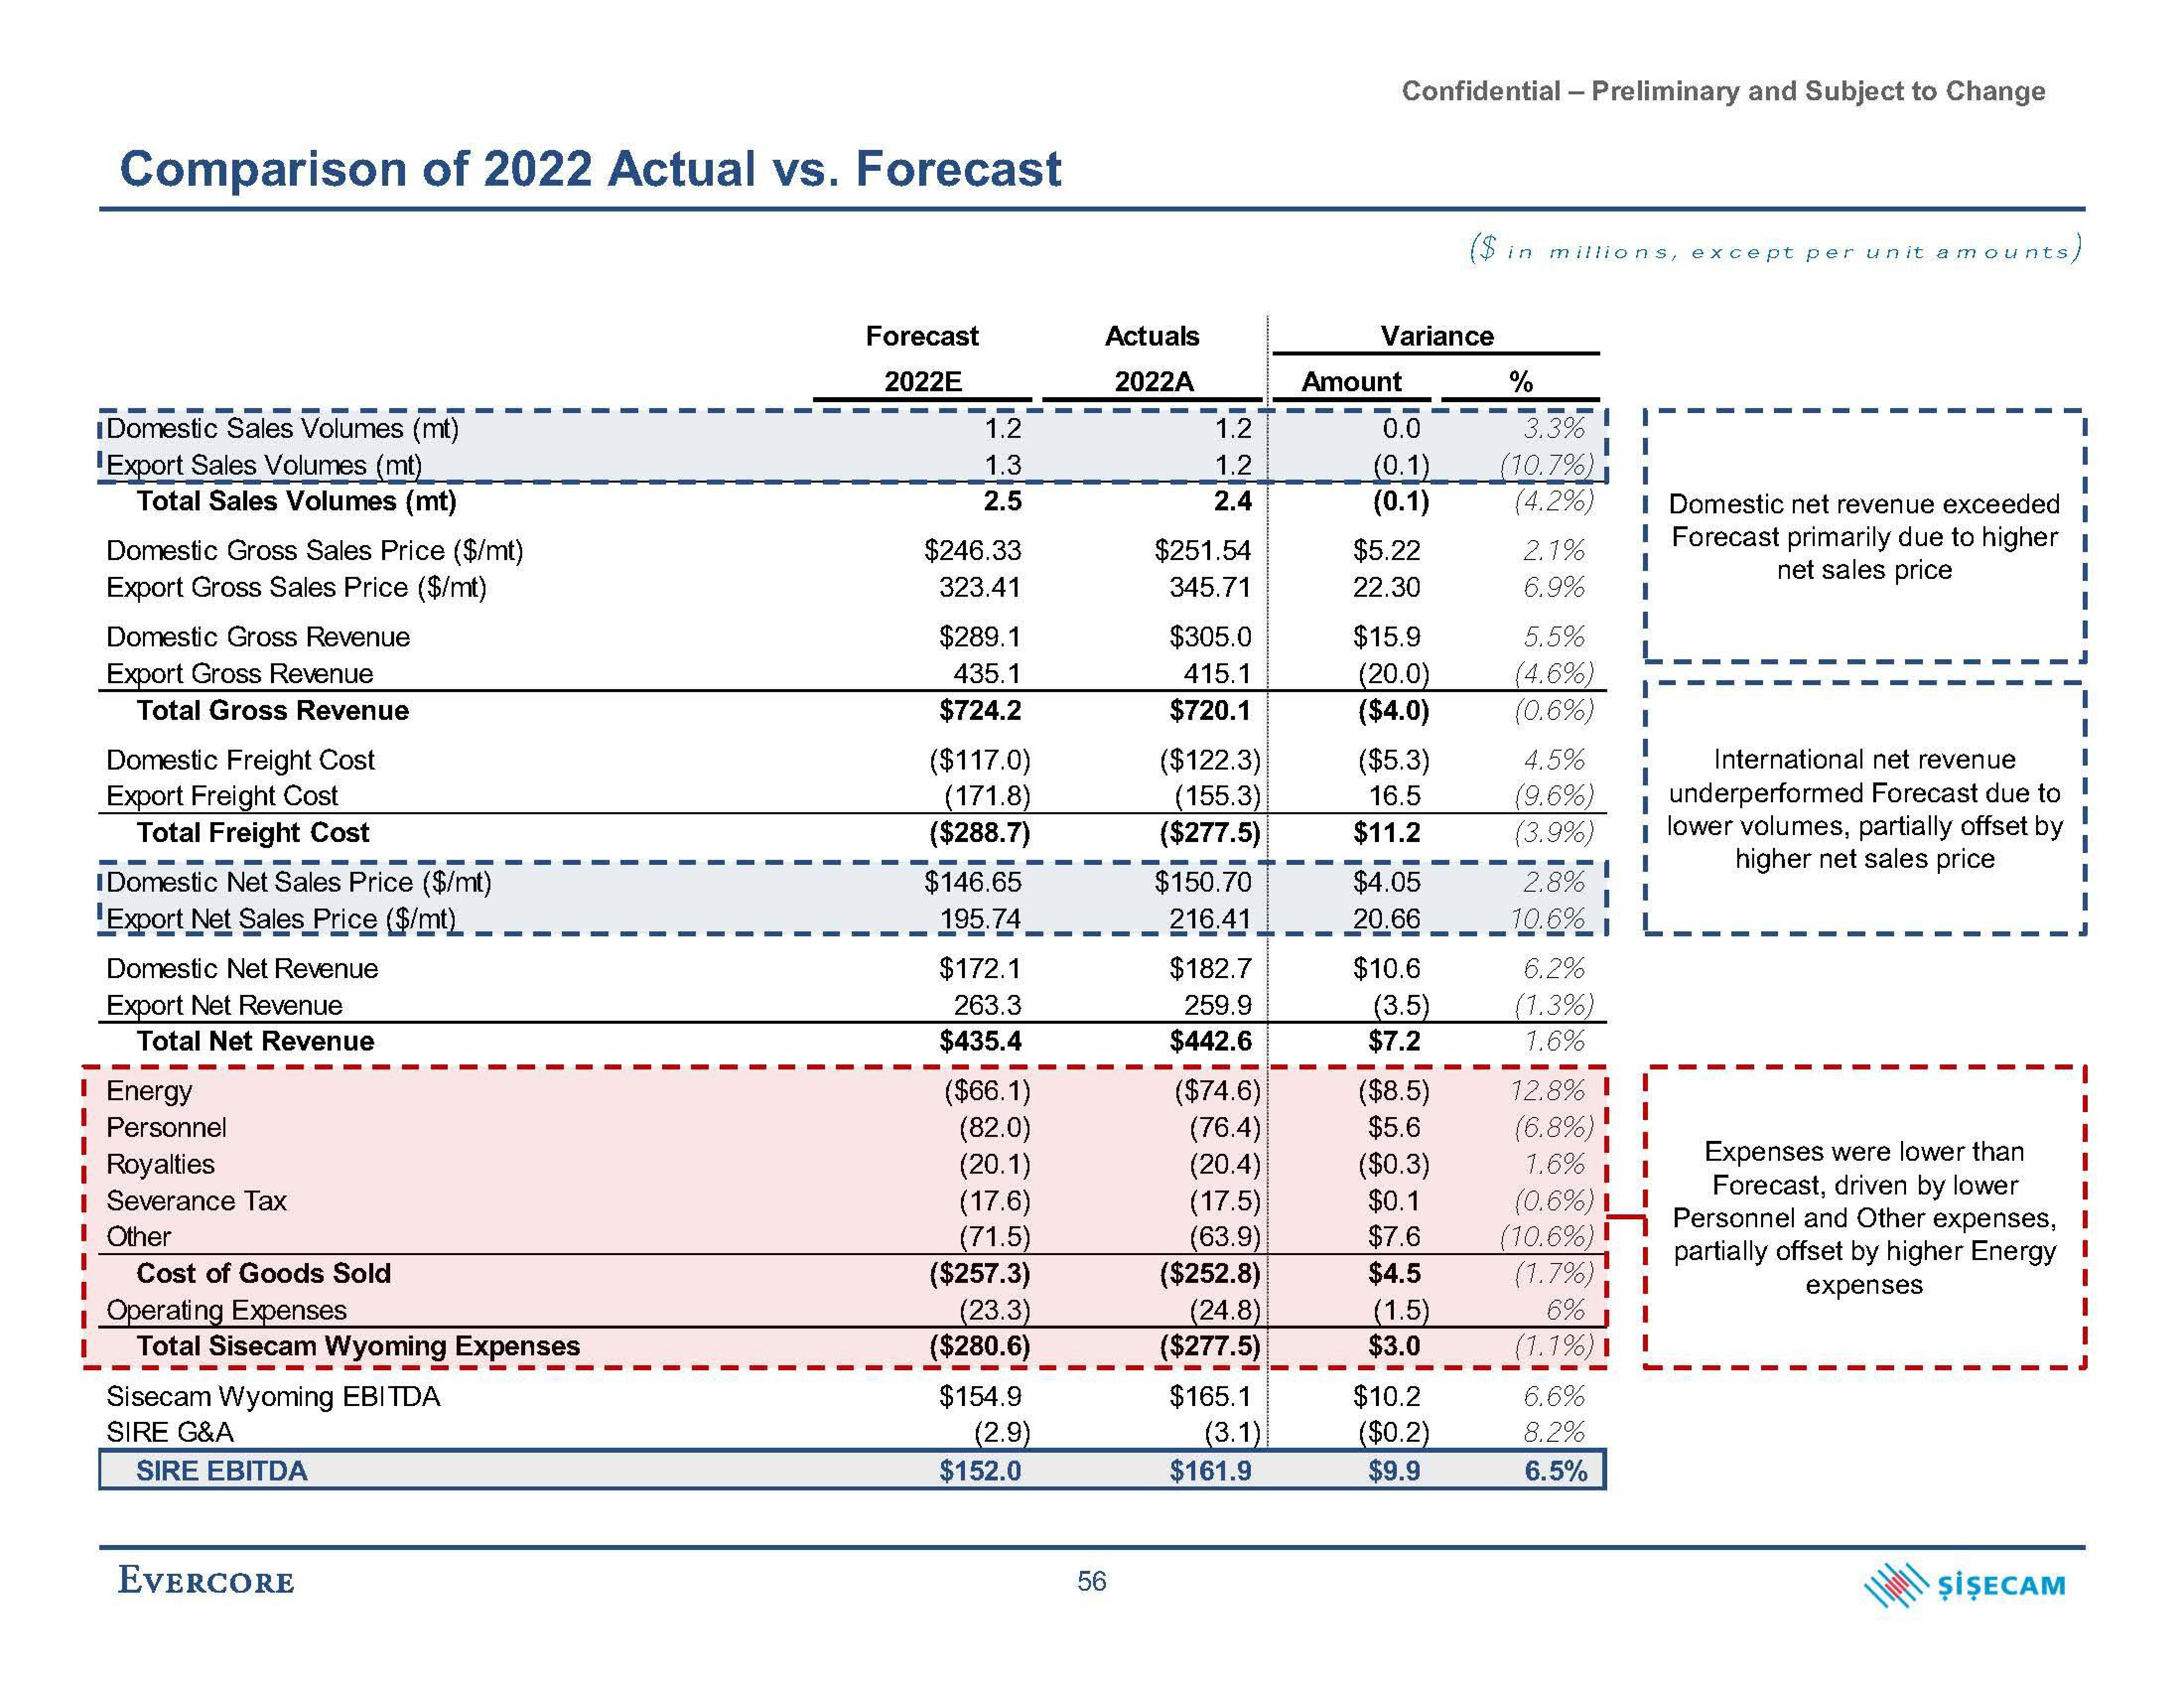
Comparison of 2022 Actual vs. Forecast
I Domestic Sales Volumes (mt)
Export Sales Volumes (mt)
Total Sales Volumes (mt)
I
I
Domestic Gross Sales Price ($/mt)
Export Gross Sales Price ($/mt)
Domestic Gross Revenue
Export Gross Revenue
Total Gross Revenue
Domestic Freight Cost
Export Freight Cost
Total Freight Cost
I Domestic Net Sales Price ($/mt)
Export Net Sales Price ($/mt)
Domestic Net Revenue
Export Net Revenue
Total Net Revenue
I Energy
Personnel
Royalties
I Severance Tax
Other
Cost of Goods Sold
Operating Expenses
I Total Sisecam Wyoming Expenses
Sisecam Wyoming EBITDA
SIRE G&A
SIRE EBITDA
EVERCORE
———
I
Forecast
2022E
1.2
1.3
2.5
$246.33
323.41
$289.1
435.1
$724.2
($117.0)
(171.8)
($288.7)
$146.65
195.74
$172.1
263.3
$435.4
($66.1)
(82.0)
(20.1)
(17.6)
(71.5)
($257.3)
(23.3)
($280.6)
$154.9
(2.9)
$152.0
Actuals
2022A
56
1.2
1.2
2.4
$251.54
345.71
$305.0
415.1
$720.1
($122.3)
(155.3)
($277.5)
$150.70
216.41
$182.7
259.9
$442.6
($74.6)
(76.4)
(20.4)
(17.5)
(63.9)
($252.8)
(24.8)
($277.5)
$165.1
(3.1)
$161.9
Confidential - Preliminary and Subject to Change
Variance
Amount
0.0
(0.1)
(0.1)
$5.22
22.30
$15.9
(20.0)
($4.0)
($5.3)
16.5
$11.2
$4.05
20.66
$10.6
(3.5)
$7.2
($8.5)
$5.6
($0.3)
$0.1
$7.6
$4.5
(1.5)
$3.0
($ in millions, except per un it amounts
unts)
$10.2
($0.2)
$9.9
%
3.3%
(10.7%)
(4.2%) I Domestic net revenue exceeded
I Forecast primarily due to higher
net sales price
2.1% I
6.9%
5.5%
(4.6%)
(0.6%)
4.5%
(9.6%)
(3.9%)
2.8%
10.6%
6.2%
(1.3%)
1.6%
12.8%
(6.8%)
1.6%
(0.6%)
(10.6%)
(1.7%)
6%
(1.1%)
6.6%
8.2%
6.5%
International net revenue
underperformed Forecast due to
I lower volumes, partially offset by
higher net sales price
Expenses were lower than
Forecast, driven by lower
Personnel and Other expenses,
I partially offset by higher Energy
expenses
ŞİŞECAMView entire presentation