Pershing Square Activist Presentation Deck
(1)
B. PF McDonald's Financial Analysis
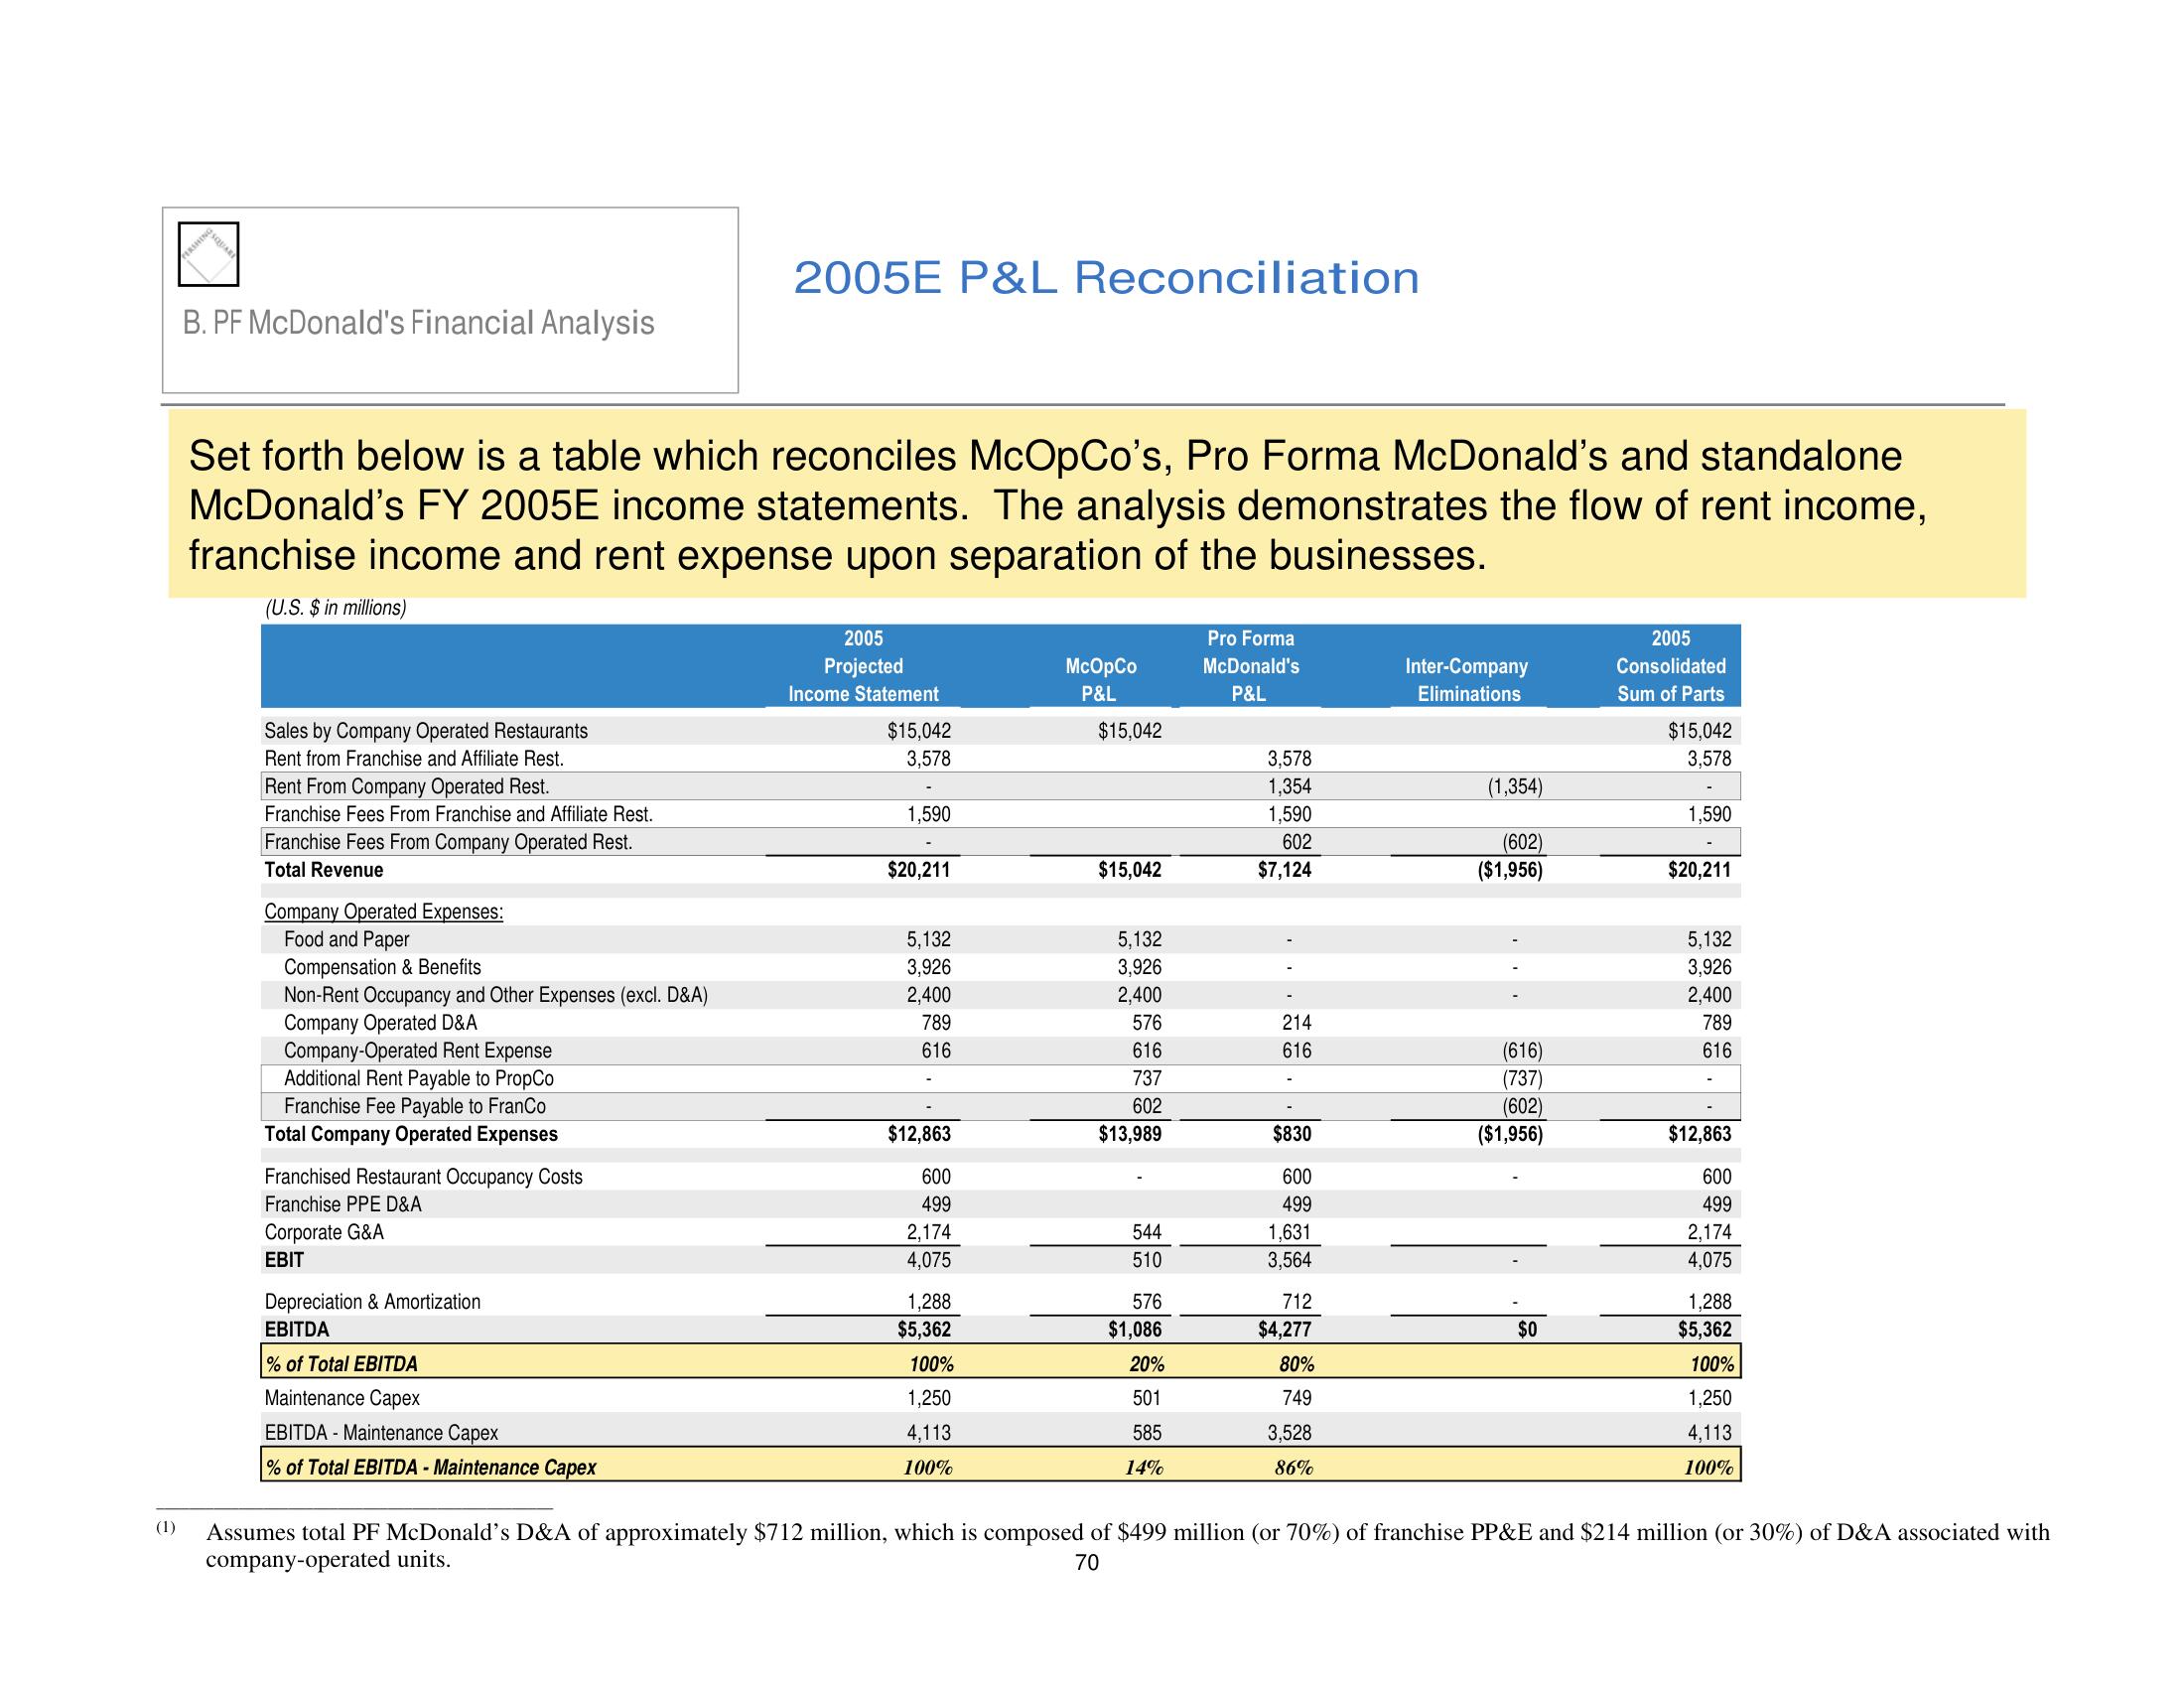
Set forth below is a table which reconciles McOpCo's, Pro Forma McDonald's and standalone
McDonald's FY 2005E income statements. The analysis demonstrates the flow of rent income,
franchise income and rent expense upon separation of the businesses.
(U.S. $ in millions)
Sales by Company Operated Restaurants
Rent from Franchise and Affiliate Rest.
Rent From Company Operated Rest.
Franchise Fees From Franchise and Affiliate Rest.
Franchise Fees From Company Operated Rest.
Total Revenue
Company Operated Expenses:
Food and Paper
Compensation & Benefits
Non-Rent Occupancy and Other Expenses (excl. D&A)
Company Operated D&A
Company-Operated Rent Expense
Additional Rent Payable to Propo
Franchise Fee Payable to FranCo
Total Company Operated Expenses
Franchised Restaurant Occupancy Costs
Franchise PPE D&A
Corporate G&A
EBIT
2005E P&L Reconciliation
Depreciation & Amortization
EBITDA
% of Total EBITDA
Maintenance Capex
EBITDA - Maintenance Capex
% of Total EBITDA - Maintenance Capex
2005
Projected
Income Statement
$15,042
3,578
1,590
$20,211
5,132
3,926
2,400
789
616
$12,863
600
499
2,174
4,075
1,288
$5,362
100%
1,250
4,113
100%
McOpCo
P&L
$15,042
$15,042
5,132
3,926
2,400
576
616
737
602
$13,989
544
510
576
$1,086
20%
501
585
14%
Pro Forma
McDonald's
P&L
3,578
1,354
1,590
602
$7,124
214
616
$830
600
499
1,631
3,564
712
$4,277
80%
749
3,528
86%
Inter-Company
Eliminations
(1,354)
(602)
($1,956)
(616)
(737)
(602)
($1,956)
$0
2005
Consolidated
Sum of Parts
$15,042
3,578
1,590
$20,211
5,132
3,926
2,400
789
616
$12,863
600
499
2,174
4,075
1,288
$5,362
100%
1,250
4,113
100%
Assumes total PF McDonald's D&A of approximately $712 million, which is composed of $499 million (or 70%) of franchise PP&E and $214 million (or 30%) of D&A associated with
company-operated units.
70View entire presentation