Nexters Results Presentation Deck
Key Operating Highlights
'000 users
Monthly paying users (¹)
10
284
Q4 2020
284
FY 2020
+28%
+27%
363
Q4 2021
362
FY 2021
$/month
Average bookings per paying user (2)
137
Q4 2020
126
FY 2020
-9%
-3%
125
Q4 2021
123
FY 2021
$m
Bookings
3%
120
Q4 2020
3%
445
FY 2020
share of
advertising
+20%
share of
advertising
+26%
5%
144
Q4 2021
5%
562
FY 2021
Source: Company information (preliminary and unaudited)
The Company defines Monthly Paying Users, or MPUS, as the number of individuals who made a purchase of a virtual item at least once on a particular platform in the 30-day period ending with the measurement
date; Quarterly MPU is the average of MPUS for each month for the respective quarter
(1)
(2)
The Company defines Average Bookings Per Paying User, or ABPPU, as its total Bookings attributable to in-game purchases in a given period, divided by the number of months in that period, divided by the average
number of MPUS during the period
nexters
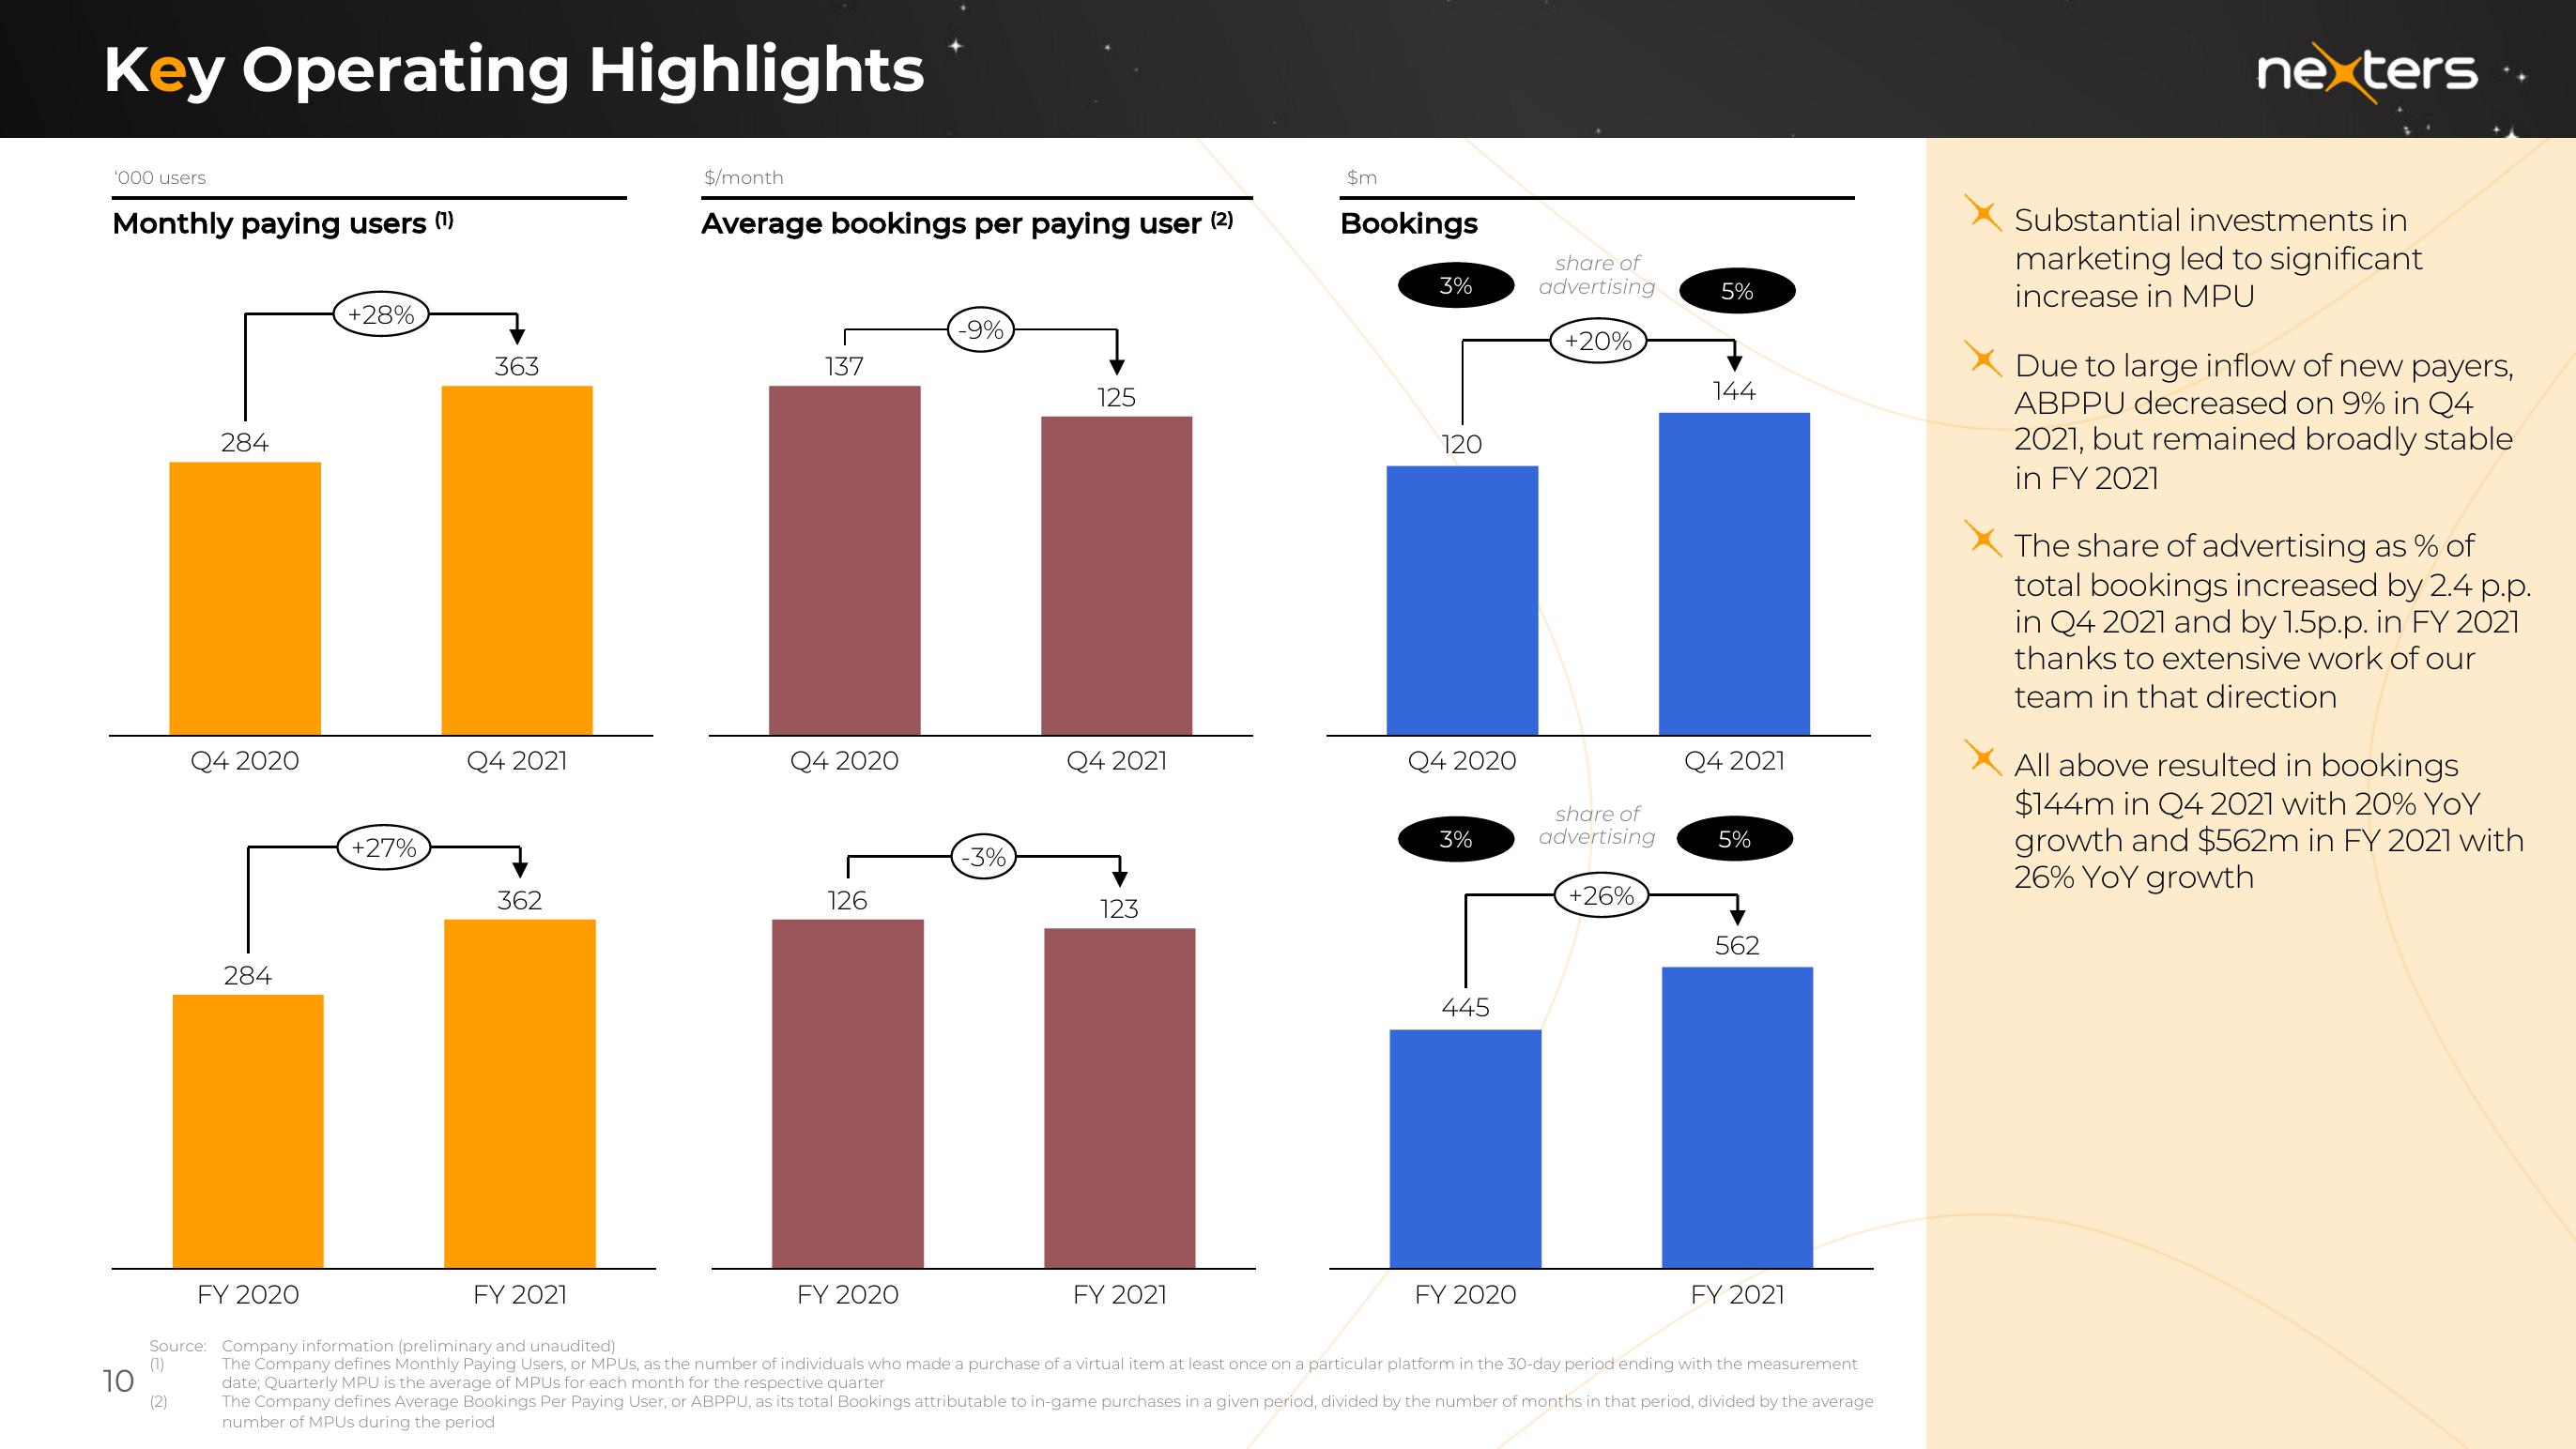
Substantial investments in
marketing led to significant
increase in MPU
X Due to large inflow of new payers,
ABPPU decreased on 9% in Q4
2021, but remained broadly stable
in FY 2021
The share of advertising as % of
total bookings increased by 2.4 p.p.
in Q4 2021 and by 1.5p.p. in FY 2021
thanks to extensive work of our
team in that direction
All above resulted in bookings
$144m in Q4 2021 with 20% YOY
growth and $562m in FY 2021 with
26% YoY growthView entire presentation