Diageo Results Presentation Deck slide image

Diageo Results Presentation Deck

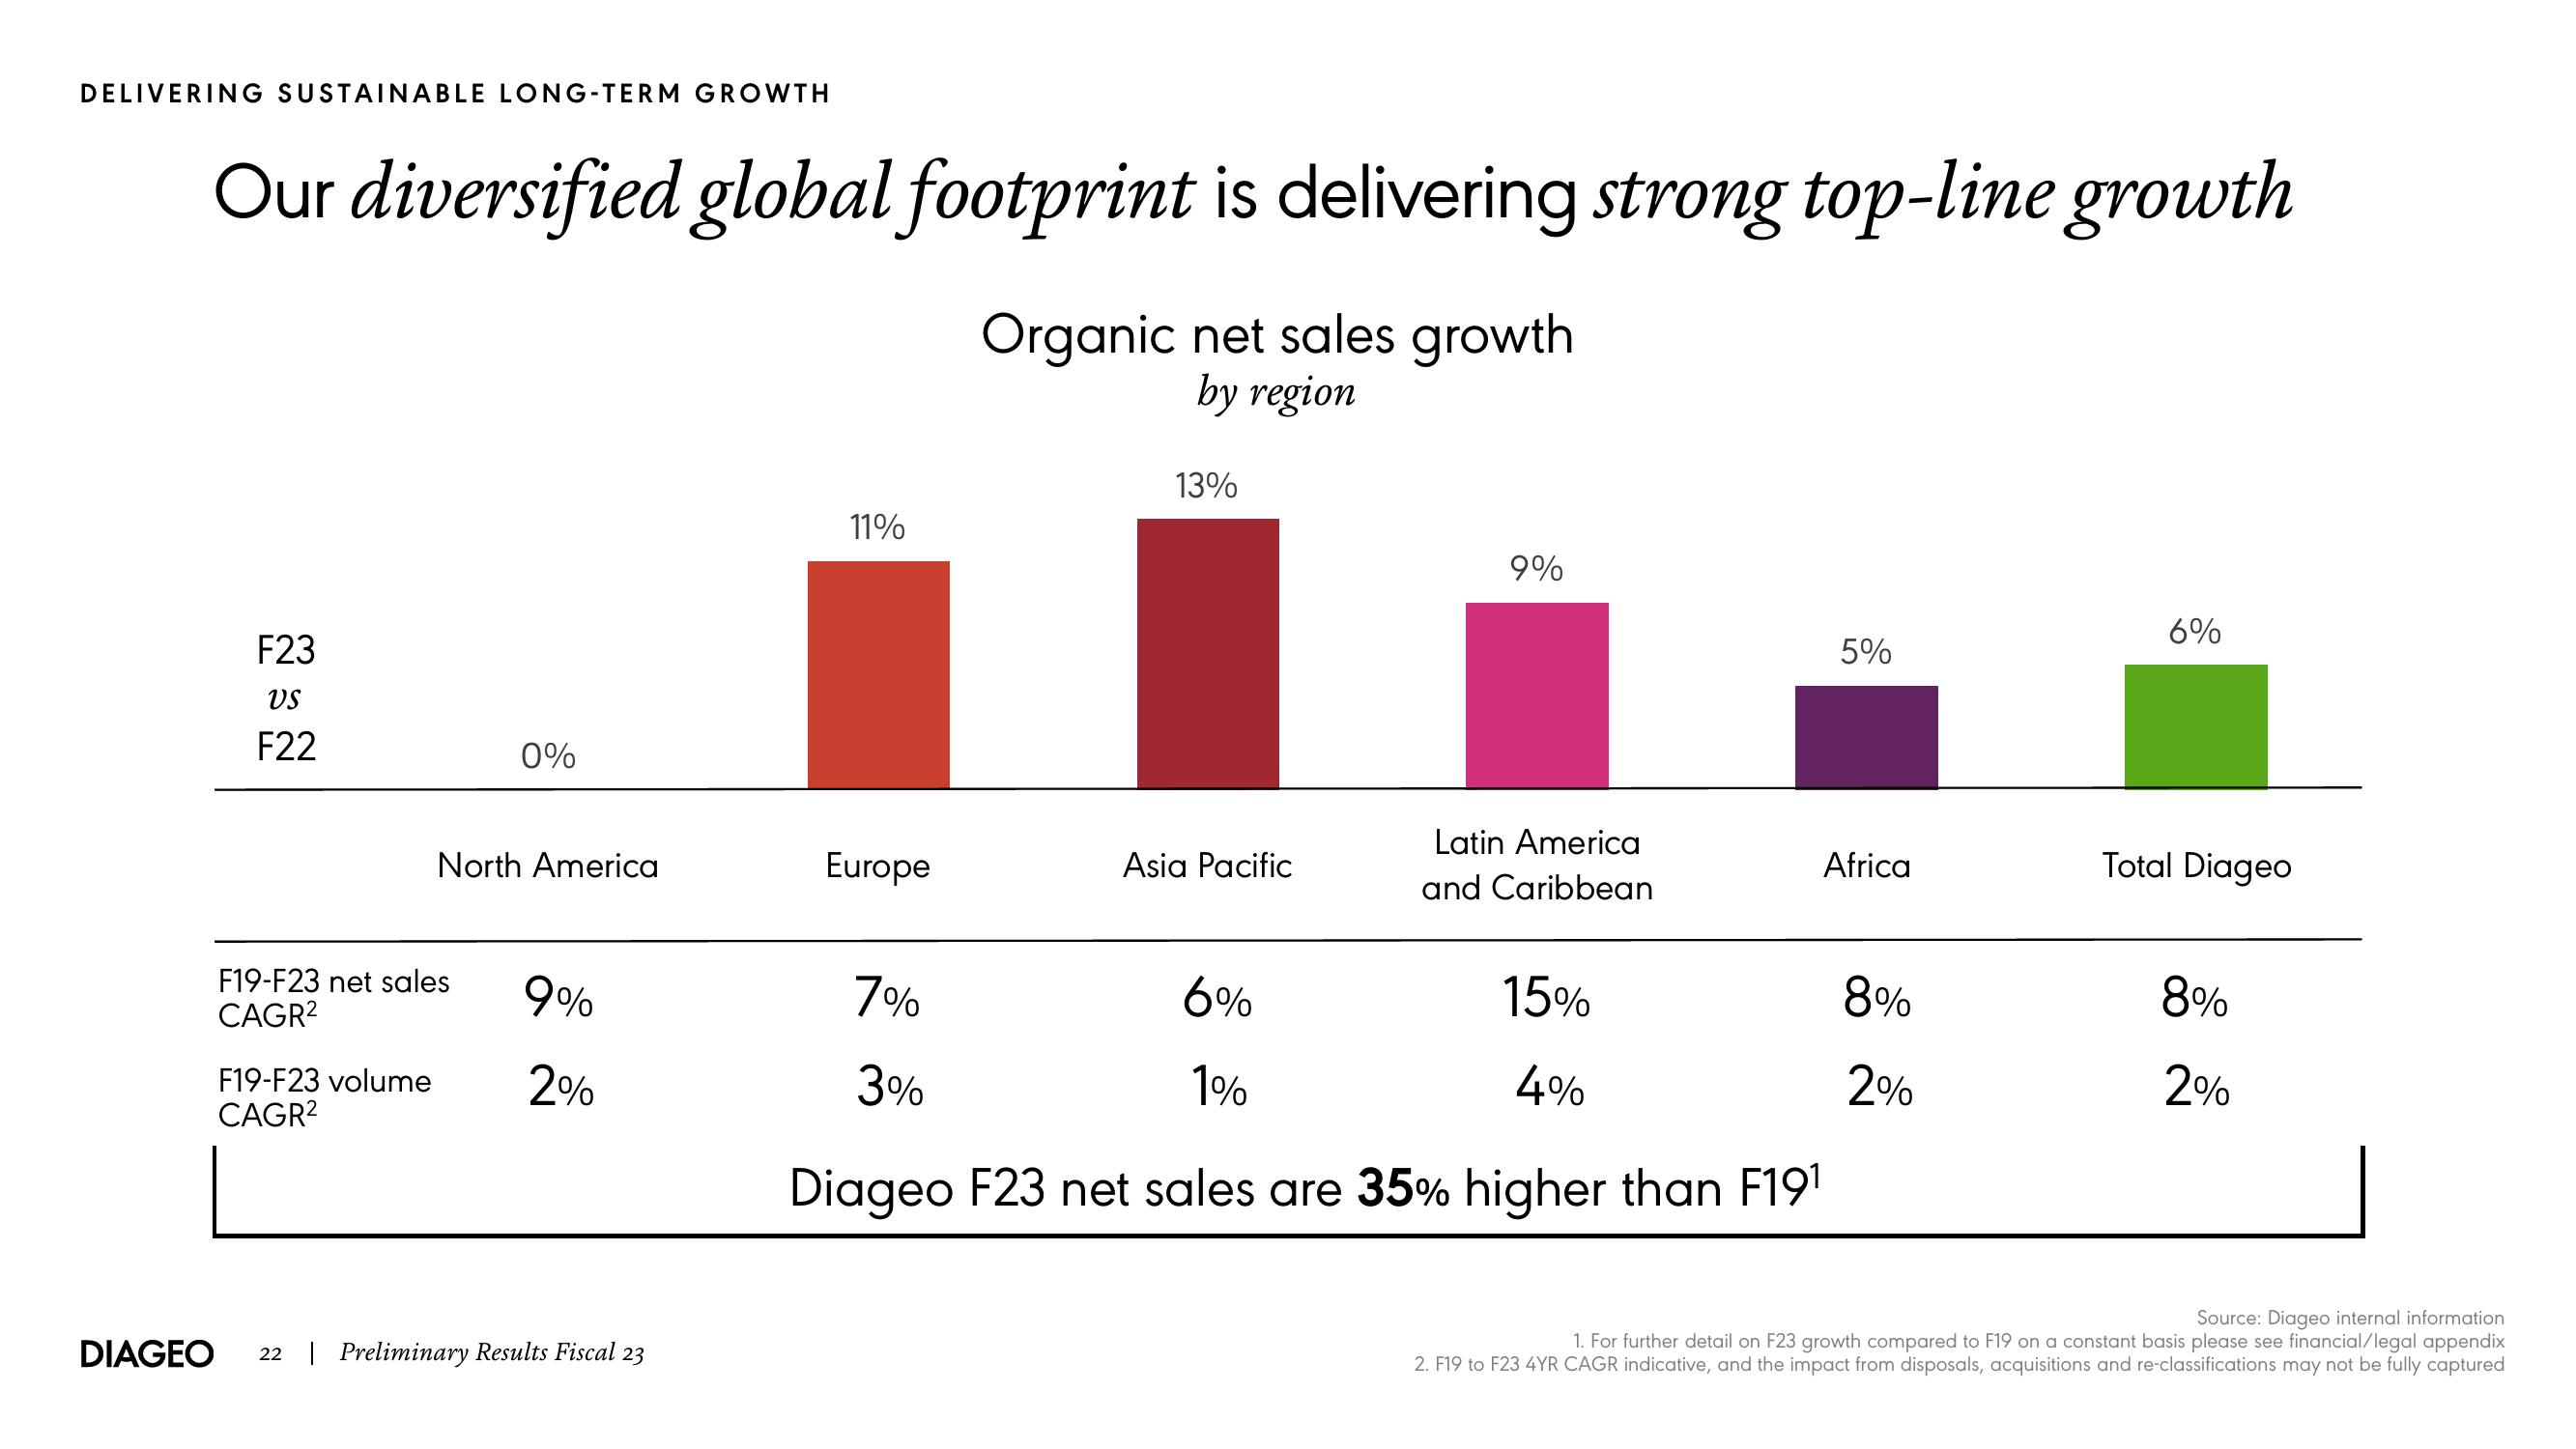
DELIVERING SUSTAINABLE LONG-TERM GROWTH Our diversified global footprint is delivering strong top-line growth DIAGEO F23 VS F22 F19-F23 net sales CAGR² F19-F23 volume CAGR² 22 0% North America 9% 2% | Preliminary Results Fiscal 23 11% Europe Organic net sales growth by region 7% 13% Asia Pacific 9% Latin America and Caribbean 6% 15% 3% 1% 4% Diageo F23 net sales are 35% higher than F19¹ 5% Africa 8% 2% 6% Total Diageo 8% 2% Source: Diageo internal information 1. For further detail on F23 growth compared to F19 on a constant basis please see financial/legal appendix 2. F19 to F23 4YR CAGR indicative, and the impact from disposals, acquisitions and re-classifications may not be fully captured
View entire presentation