Bank of America Investment Banking Pitch Book
Preliminary Valuation Considerations
Illustrative LBO Analysis Pioneer Base Case (Cont'd)
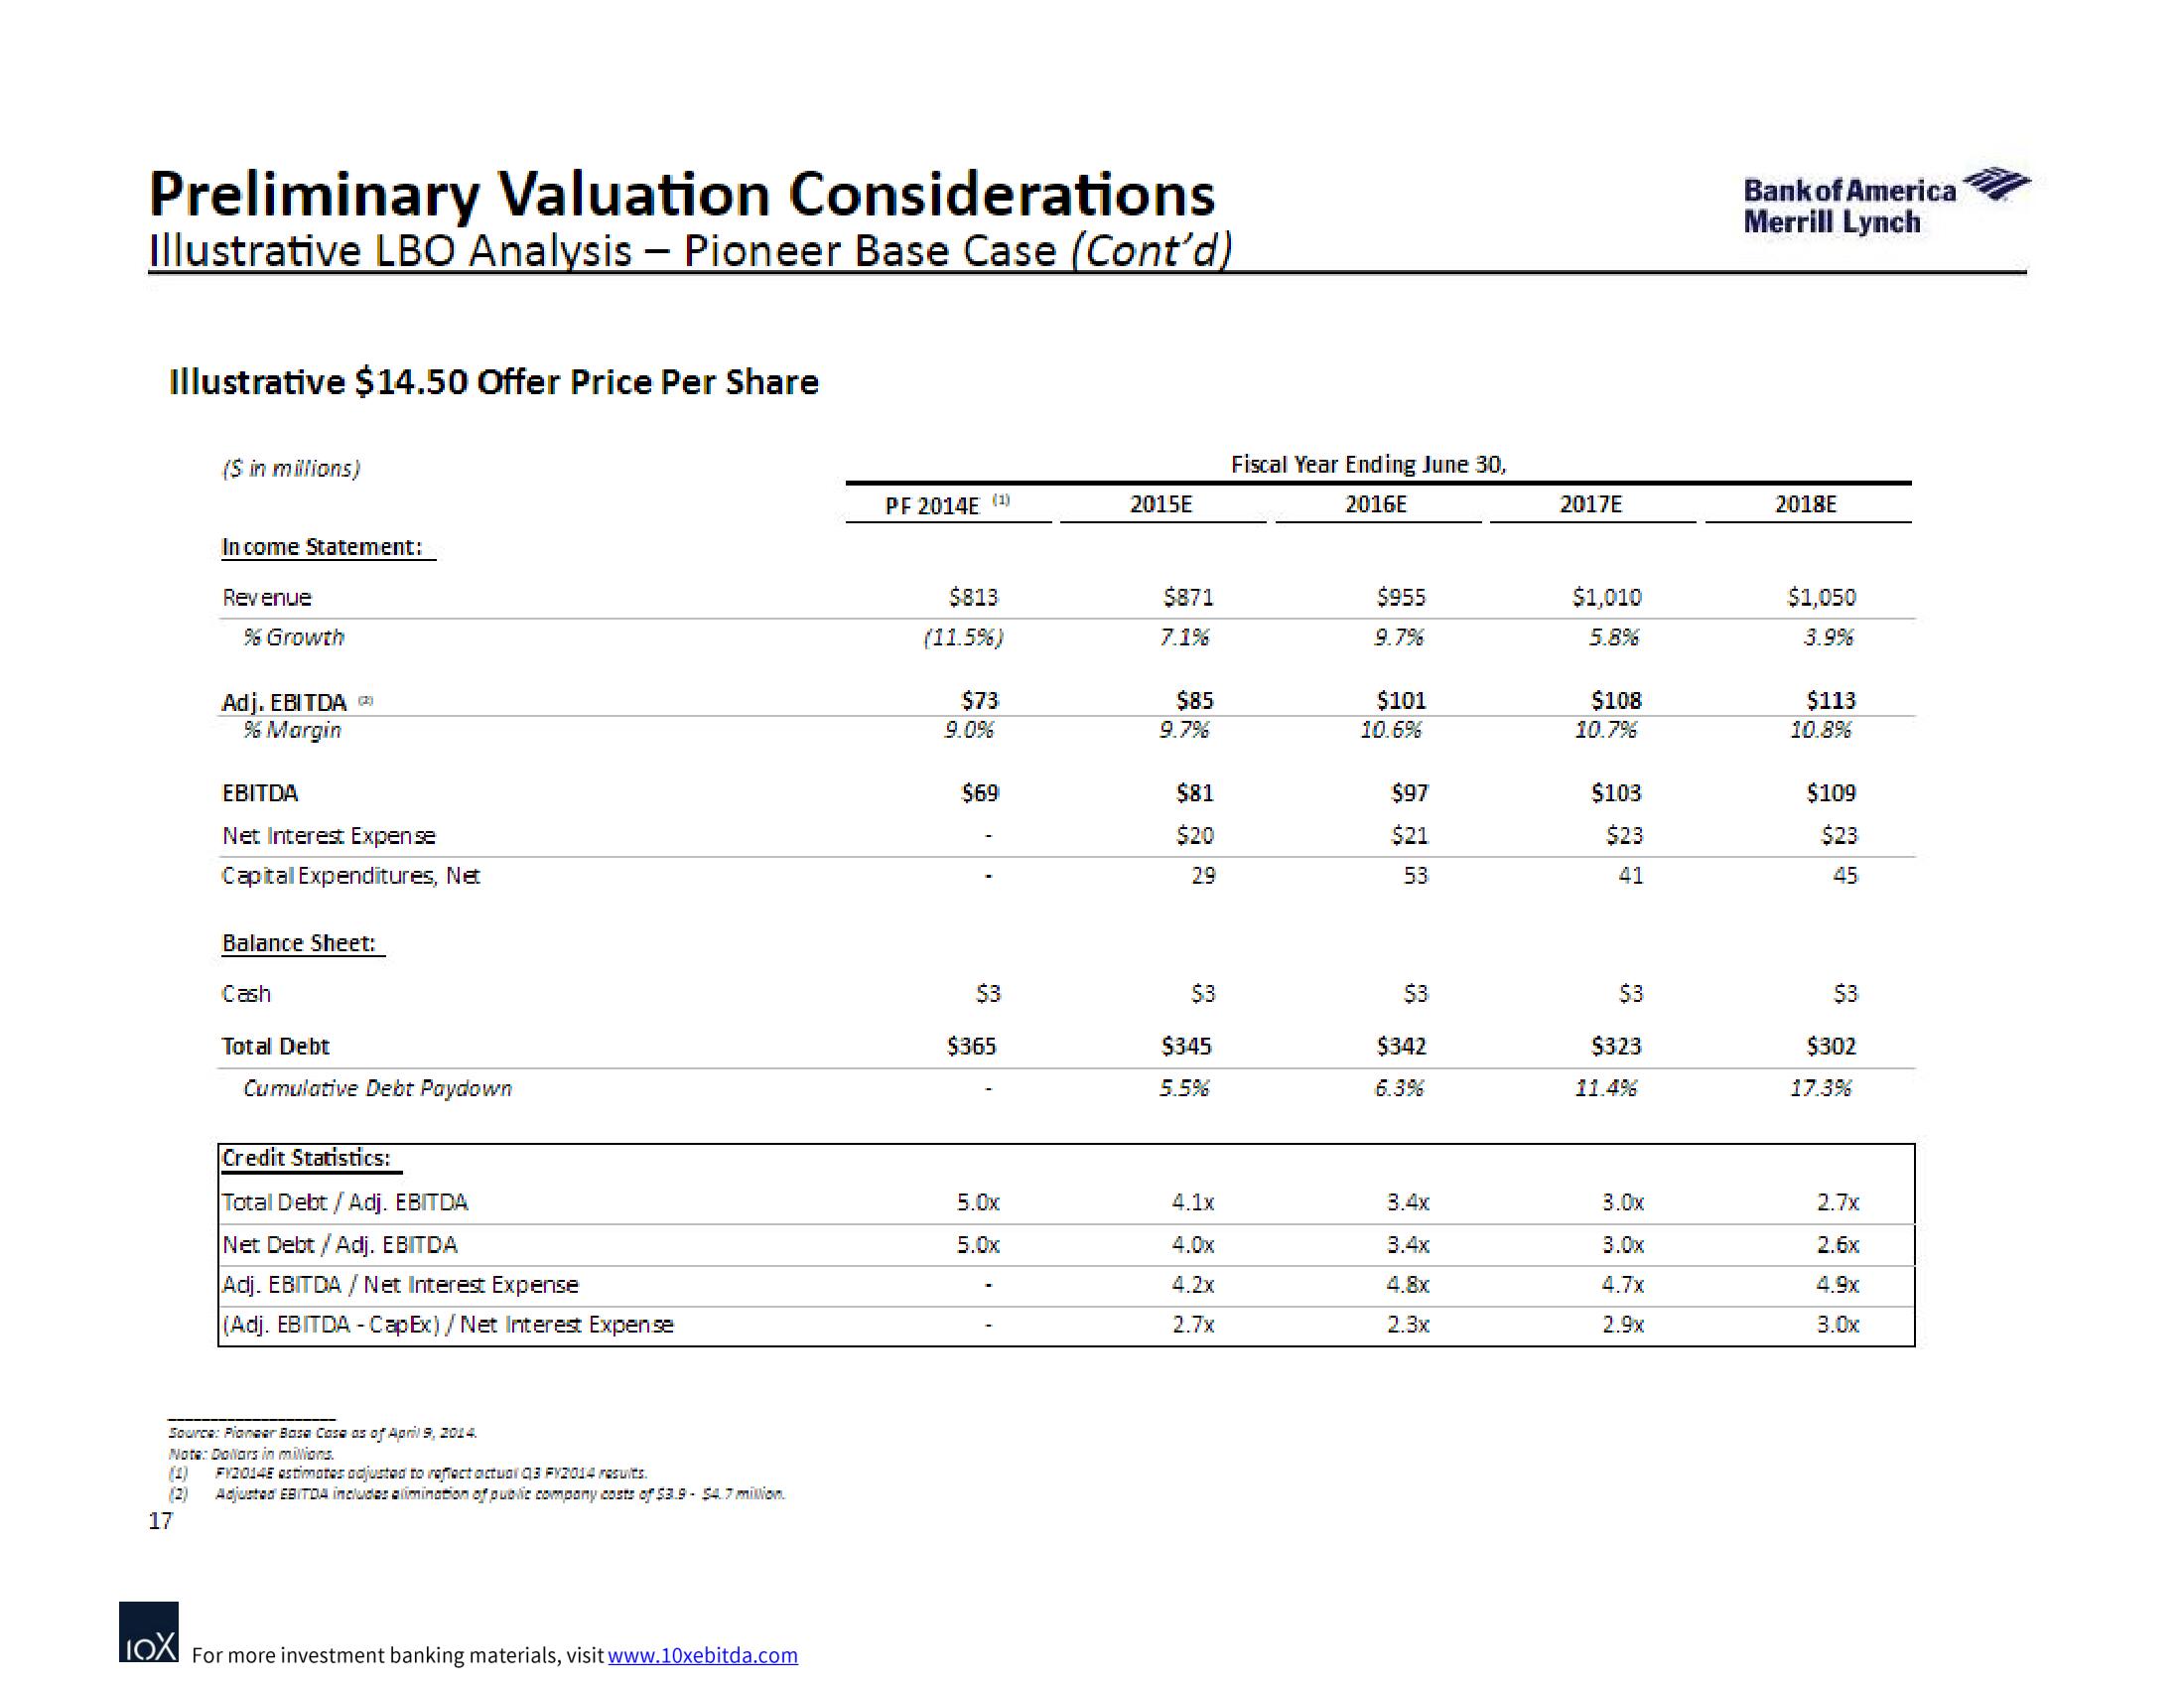
Illustrative $14.50 Offer Price Per Share
(S in millions)
In come Statement:
Revenue
96 Growth
Adj. EBITDA
% Margin
EBITDA
Net Interest Expense
Capital Expenditures, Net
Balance Sheet:
Cash
Total Debt
Cumulative Debt Paydown
Credit Statistics:
Total Debt / Adj. EBITDA
Net Debt / Adj. EBITDA
Adj. EBITDA / Net Interest Expense
(Adj. EBITDA - Cap Ex)/Net Interest Expense
Source: Pioneer Bosa Cosa as of April 9, 2014.
Note: Dollars in milions.
(4) FY20145 estimates adjusted to reflect actual 03 FY2014 results.
(2) Adjustad EBITDA includes alimination of public company costs of $3.9 - 54.7 million.
17
LOX For more investment banking materials, visit www.10xebitda.com
PF 2014E (1)
$813
(11.5%)
$73
9.0%
$69
$3
$365
5.0x
5.0x
2015E
$871
7.1%
$85
9.7%
$81
$20
2.9
$3
$345
5.5%
4.1x
4.2x
2.7x
Fiscal Year Ending June 30,
2016E
$955
9.7%
$101
10.6%
$97
$21
53
$3
$342
6.3%
3.4x
3.4x
4.8x
2.3x
2017E
$1,010
5.8%
$108
10.7%
$103
$23
41
$3
$323
11.4%
3.0x
3.0x
4.7x
2.9x
Bank of America
Merrill Lynch
2018E
$1,050
3.9%
$113
10.8%
$109
$23
45
$3
$302
17.3%
2.7x
2.6x
4.9x
3.0xView entire presentation